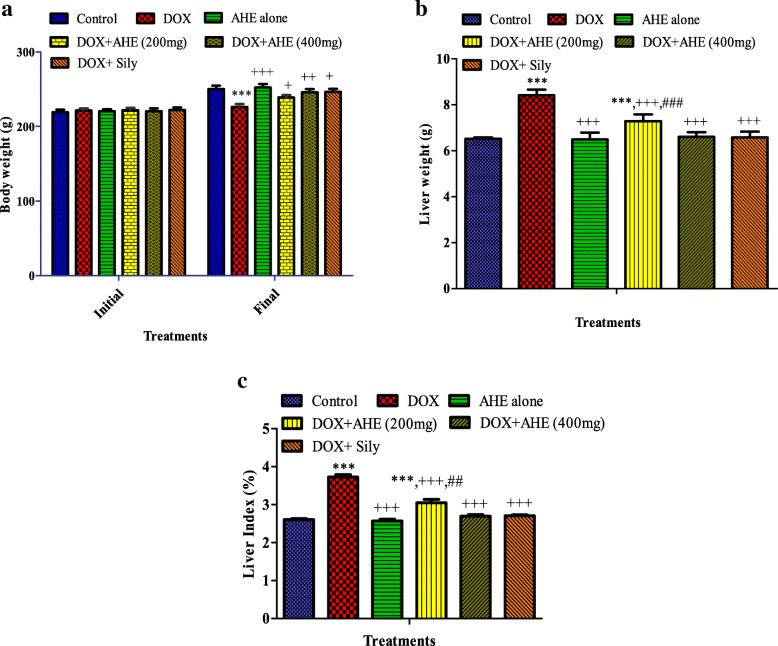
Fig. 1.
Effect of the ethyl acetate extract of A. hydaspica (AHE) on a body weight, b liver weight and c liver index (%) in various treatment groups. Mean ± SE (n = 6); statistical symbols in a indicated significant difference in final vs initial body weight; in b and c *, **, *** indicated significance from the control group at p < 0.05, p < 0.001 and p < 0.0001 probability level, +, ++, +++ indicate significance from the DOX group at p < 0.05, p < 0.01 and p < 0.0001 while ##, ### indicate significance of AHE 400 mg kg bw treatment vs AHE 200 mg kg bw treatment group at p < 0.001 and p < 0.0001 probability level respectively (One way ANOVA followed by Tukey’s multiple comparison tests)

