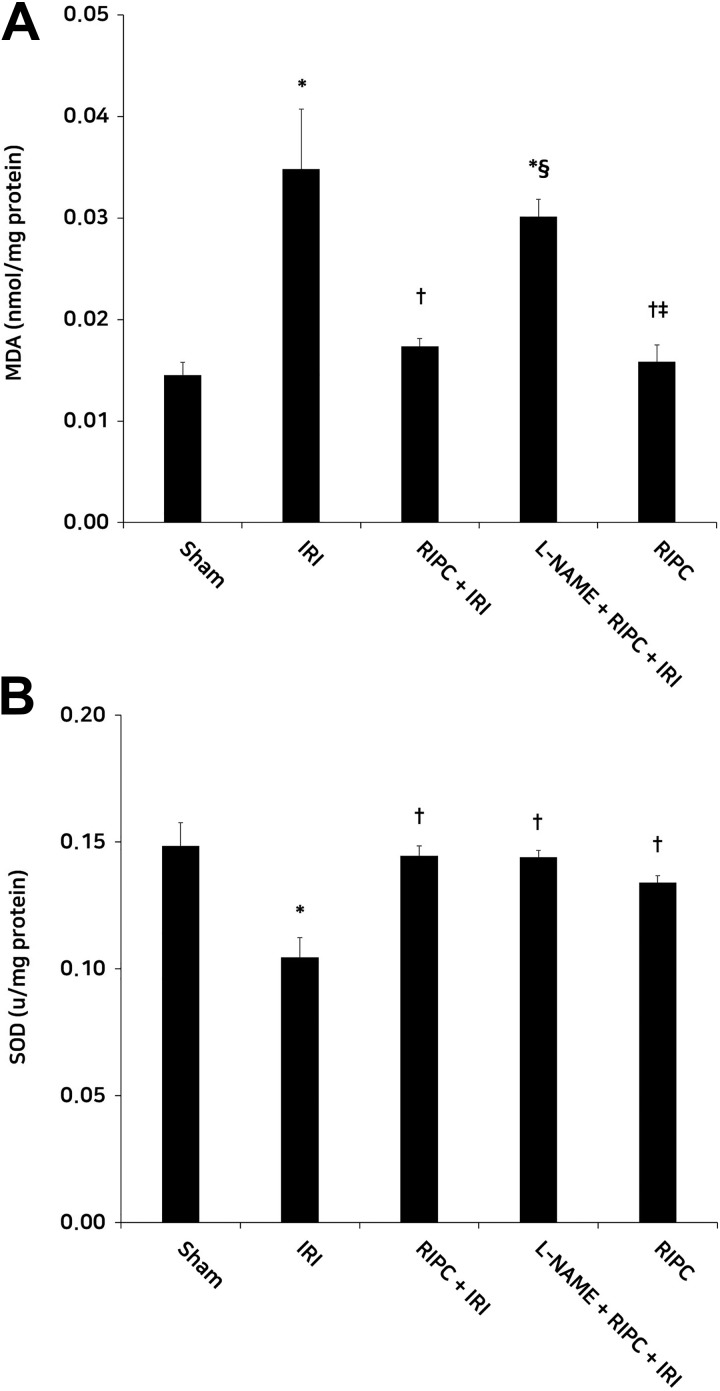
Figure 3.
Renal tissue MDA (A) and SOD (B) levels in the experimental groups. (A) the RIPC + IRI group showed lower MDA levels than the IRI group. The MDA levels in the L-NAME + RIPC + IRI group were higher than in the RIPC + IRI group. (B) Compared with the IRI group, the RIPC + IRI group showed significantly high SOD levels. *P < .05 and .001 for MDA and SOD, respectively, versus the sham group; † P < .05 for MDA and SOD, versus the IRI group; § P < .05 for MDA, versus the RIPC + IRI group; P < .05 for MDA, versus the L-NAME + RIPC + IRI group. Data are expressed as mean ± SEM (n = 6 rats/group). MDA, malondialdehyde; SOD, superoxide dismutase; IRI, ischemia reperfusion injury; RIPC, remote ischemic preconditioning; l-name, N-nitro-l-arginine methyl ester; SEM, standard error of the mean.

