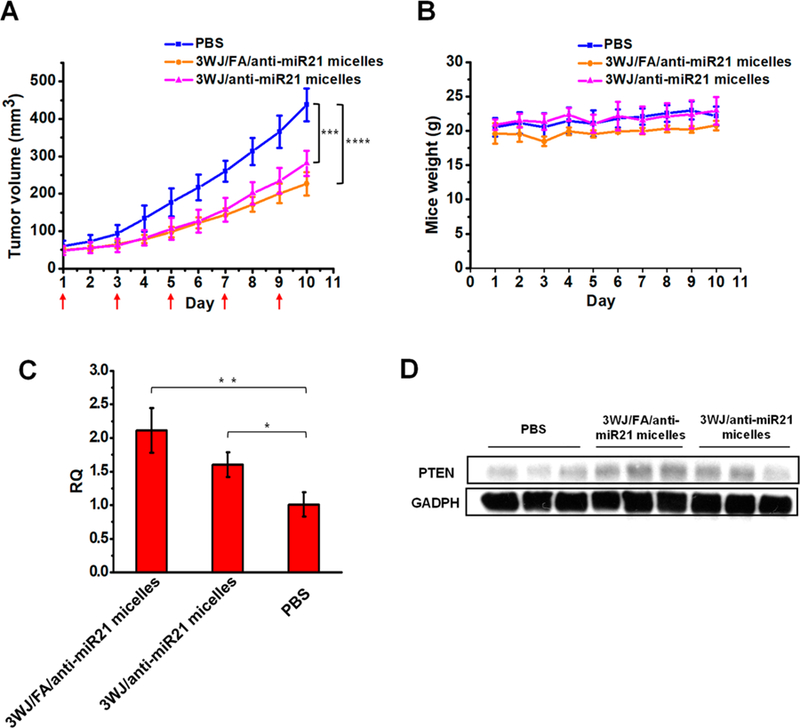
Figure 6.

In vivo therapeutic effect of RNA micelles in mice with xenograft. (A) Tumor regression curve over the course of five injections (red arrow shows the day of injection). (B) Mice weight curve during treatment period. (C) qRT-PCR and (D) Western blot analysis showing the up-regulation of PTEN after the in vivo delivery of anti-miR21.
