
Figure 3. Cluster#C1 and #C2 cells are committed hierarchical unipotent progenitors for neutrophil production in vivo.
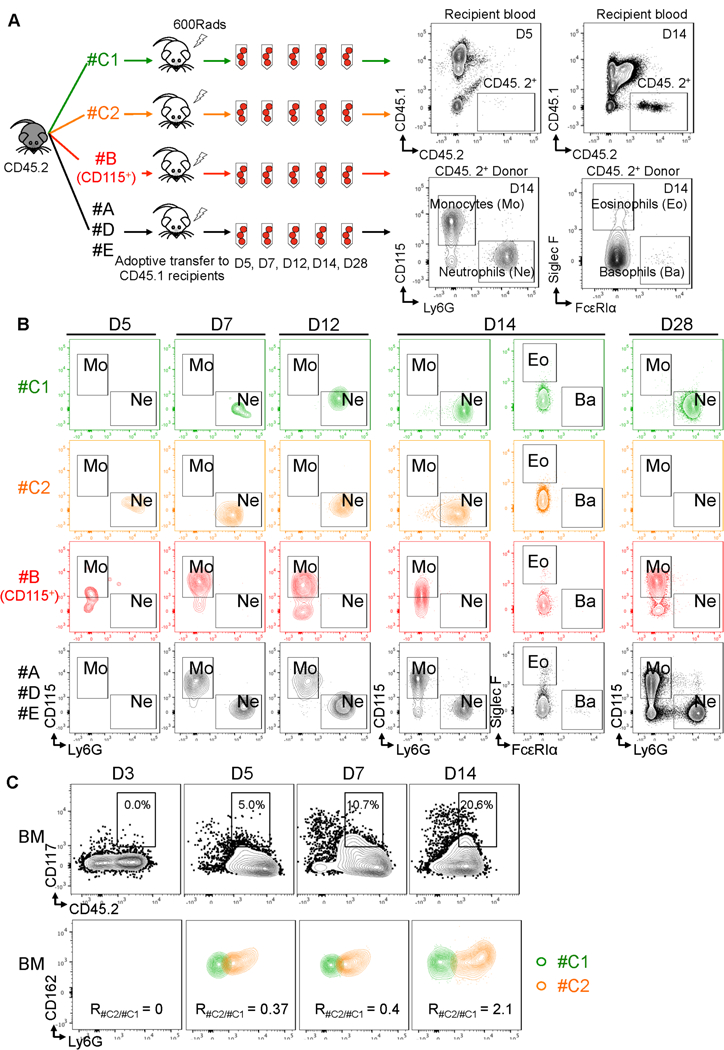
(A) Scheme showing the experimental procedure. Cluster#C1 and #C2 were sorted from CD45.2 donors and adoptively transferred into irradiated wild-type CD45.1 recipient mice. #B (CD115+), #A, D, and #E cells were sorted from the same donors for this experiment and served as controls. FACS sorting strategies for these cell types are shown in Figure 2B using mass cytometry, and Figure S10B using flow cytometry. Each recipient group includes 25 mice. Each recipient received 50,000 donor cells. After the transfer, peripheral blood was collected for flow cytometry of CD45. 2+ cells from 5 recipients of each group at days (D) 5, 7, 12, 14, 28 (D5, D7, D12, D14, D28), respectively. CD45.2+ cells were evaluated for the donor cell-derived monocytes (CD115+), neutrophils (Ly6G+), eosinophils (Siglec F+), and basophils (FcεRIα+). N = 5 mice for each time point in each group. (B) Cluster#C1 and #C2 cells produce only neutrophils in vivo. Representative plots show the appearance of neutrophils and monocytes in each recipient group at the time points indicated. Results are representative of two independent experiments. (C) Cluster#C1 produces #C2 cells in vivo. #C1 cells were sorted from CD45.2 donors and adoptively transferred into irradiated wild-type CD45.1 recipient mice. FACS sorting strategies for #C1 cells are shown in Figure 2B using mass cytometry, and Figure S10B using flow cytometry. After transfer, BM was collected for flow cytometry of CD45. 2+ cells from 3 recipients of each group at days (D) 3, 5, 7, 14 (D3, D5, D7, D14), respectively. CD117+CD45.2+ cells were evaluated for the donor #C1 homing to bone marrow and differentiation into #C2 cells. Expression in recipients of #C1 and #C2 cells are identified by the panel shown in Figure 2B and Figure S10B and overlaid for display. #C2 differentiation into #C2 cells are shown as Ratio of #C2 : #C1 (R#C2/#C1).