
Figure 4. Cluster#C1 NeP and #C2 cells are increased in BM with tumor and promote tumor growth in vivo.
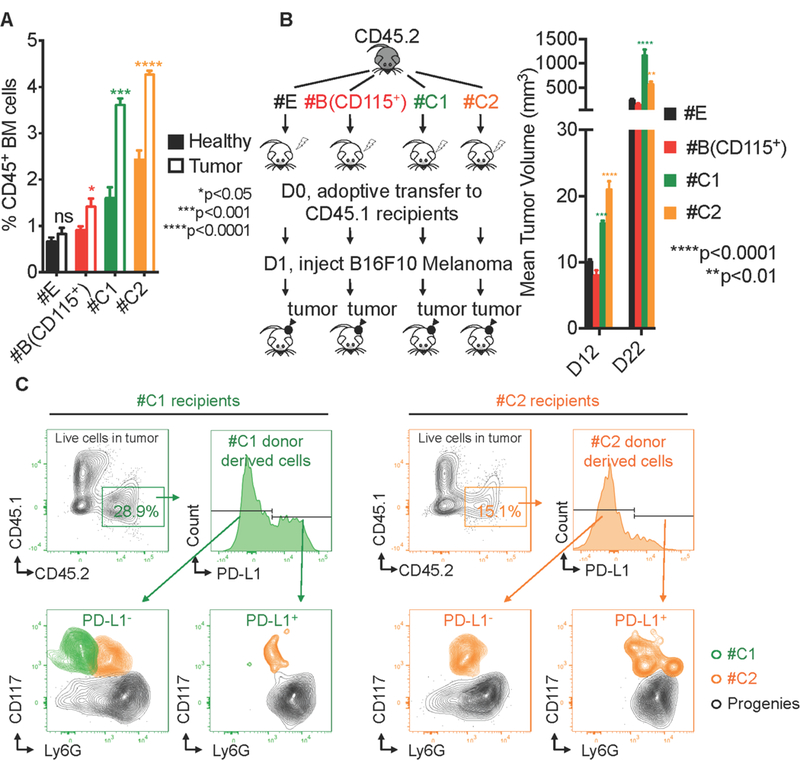
(A) Cluster#C1 NeP and #C2 cells are increased in BM of tumor-bearing mice. 5 × 10⁵ B16F10 melanoma cells were SubQ injected into the rear flank of wild-type recipient mice for primary tumor growth. The frequency of Cluster#E, #B (CD115+), #C1 and #C2 were detected in BM from tumor-bearing mice at 14d post-injection (open bars) or their healthy counterparts (solid bars). N = 15. Error bars indicate mean (SD). (B) Left, scheme showing the experiment procedure. Cluster#E, #B (CD115+), #C1, and #C2 were sorted from the same CD45.2 wild type donors and were adoptively transferred into sub-lethally irradiated congenic CD45.1 recipients. FACS sorting strategies for these cell types are shown in Figure 2B using mass cytometry, and Figure S10B using flow cytometry. Each recipient received 5 × 10⁴ donor cells. The next day, 3 × 10⁵ B16F10 melanoma cancer cells were SubQ injected into each recipient mouse. Right, the tumor volume in each recipient was measured at 12d and 22d post-injection. Results are representative of 2 independent experiments. N = 5 mice in each group. Error bars indicate mean (SD). (C) #C1 and #C2 cells infiltrate to tumor and generate PD-L1 positive progenies. At D22 after the adoptive transfer, the tumors were harvested from recipients. Live singlet cells in tumor were evaluated using flow cytometry. CD45+ donor-derived cells were analyzed for PD-L1 expression. #C1, #C2, and donor-derived neutrophils were identified with the panel from Figure 2B and Figure S10B and overlaid for display.