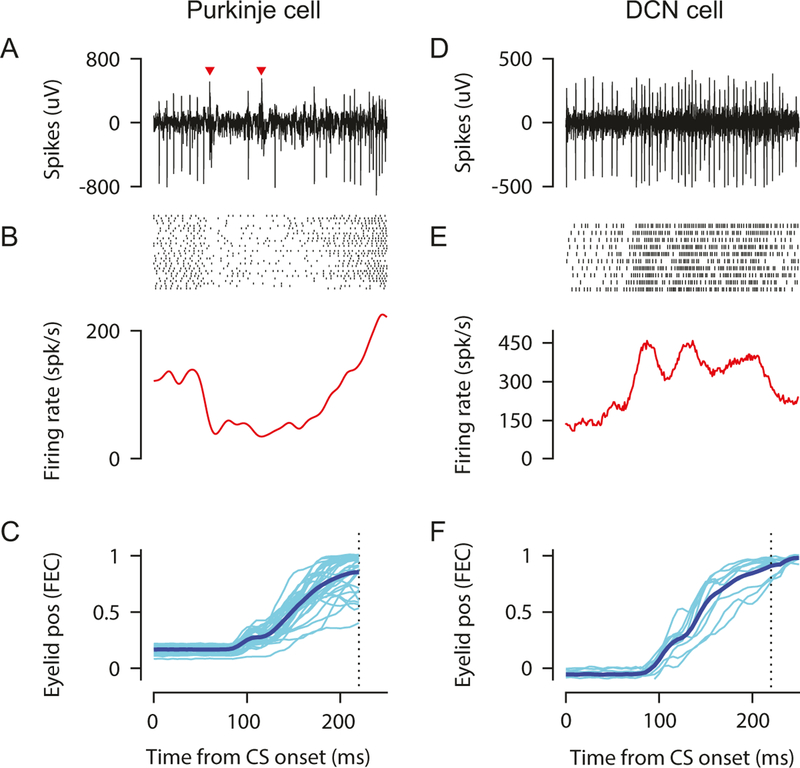
Fig. 8.
Example Purkinje (a–c) and DCN (d–f) cell recorded in eyeblink hot spots of cerebellar cortex and anterior interpositus during EBC. (a, d) Extracellular signal during a single trial; (b, e) raster of spike times (top) and peristimulus time histogram (bottom) for multiple paired trials; (c, f) eyelid positions for the same trials (light thin traces). Average eyelid position trace indicated by dark thick trace. Used with permission from [12]

