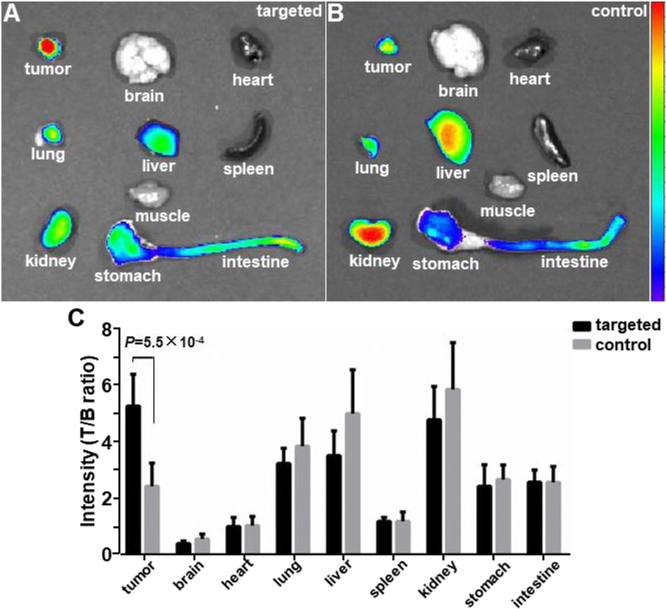
Figure 6. Biodistribution of peptide heterodimer.
Representative fluorescence images are shown from excised mouse organs at ~2 hours post-injection of A) targeted peptide heterodimer QRH*-KSP*-E3-Cy5.5 and B) control peptide (GGGAGGG)2KK-Cy5.5. C) Fluorescent signals were quantified from individual organs (n = 6) for each peptide. The mean fluorescence intensity for targeted was significantly greater than that for control, 5.28±1.14 versus 2.24±0.82, P=5.5×10⁻⁴ by unpaired t-test.

