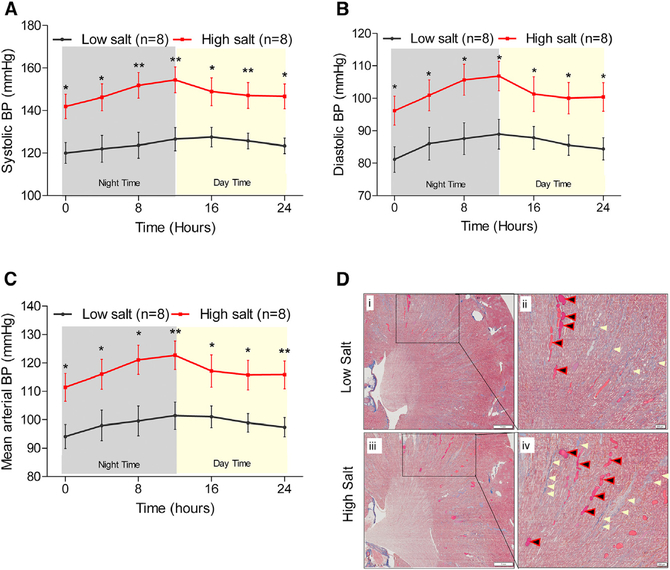
Figure 1. Hemodynamic and Renal Responses to Salt-Loading.
(A–C) Systolic (A), diastolic (B), and mean (C) arterial pressure data obtained from BP radio telemetry studies of 50- to 52-day-old rats on low (0.3% NaCl) or on high (2% NaCl) salt containing diets. Black line: data from rats on a low salt diet (n = 8). Red line: data from rats on a high salt diet (n = 8). Data points are 4 hr moving averages. *p < 0.05, **p < 0.01.
(D) Representative renal histological images of rats from the low or high salt-fed rats. Left: i and iii display images of low and high salt-fed rat kidney sections stained with Masson’s trichrome (8× magnification). The scale on the left panel (images labeled i and iii) are set at 1 mm. The boxed regions in the left panel were further magnified (40×) into the right panels (ii and iv). The scale on the right panel (images labeled ii and iv) are set at 200 μm (micrometer). Blue areas marked by cream-colored arrows denote staining for collagen, a fibrosis marker. Black/red arrows point to pink-color-filled protein casts.

