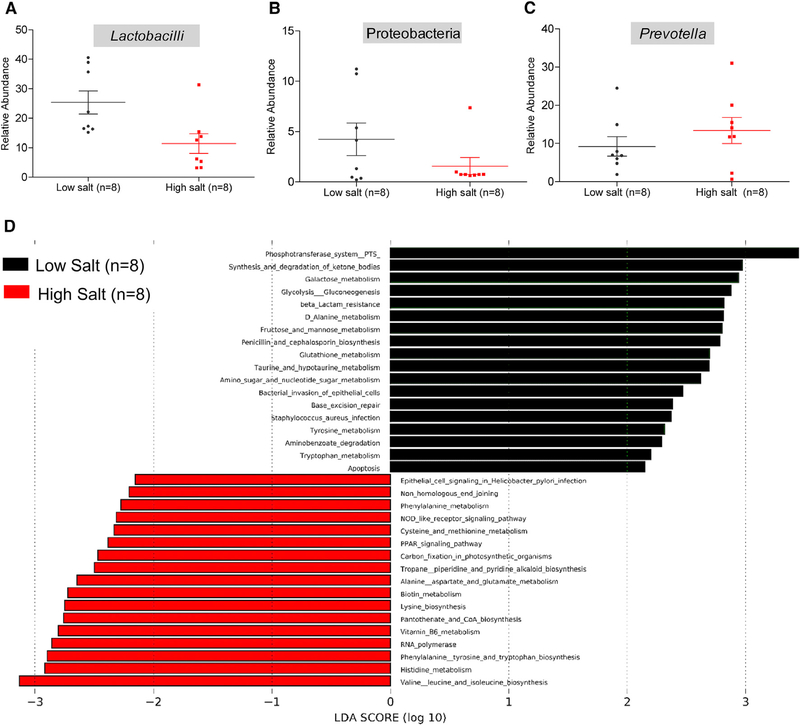
Figure 4. Assessment of Microbiotal Profiles and Functional Data from 16S RNA Sequencing of Fecal Samples from S Rats Fed with Low or High Salt.
(A–C) Relative abundance of Lactobacilli (A), Proteobacteria (B), and Prevotella (C) in S rats on low or high salt diets. Plotted are dots representing values from each rat along with a mean ± SEM.
(D) Functional analysis of microbiotal profiles. Black bars represent functional pathways enriched in the low salt-fed group. Red bars represent functional pathways enriched in the high salt-fed group.

