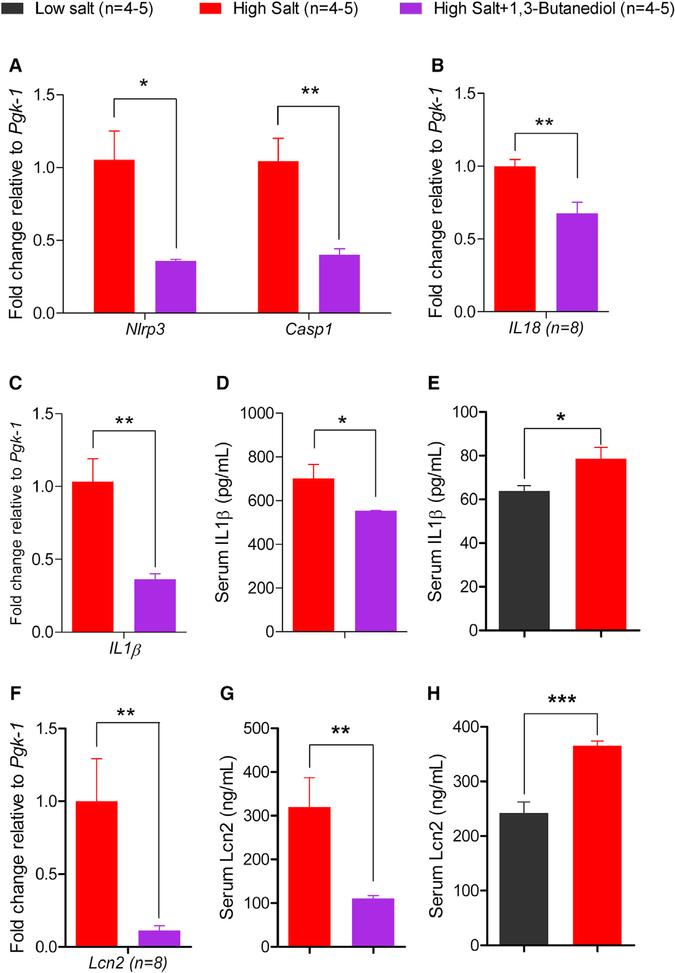
Figure 6. Assessment of Renal Nlrp3 Inflammasome and Related Measures of Inflammation.
(A–C) Comparisons of renal quantitative real-time PCR data of Nlrp3 and Casp1 (A), IL18 (B), and IL1β (C) from 1,3-butanediol-treated rats compared to the rats without the 1,3-butanediol treatment. Pgk-1, phosphoglycerokinase-1.
(D and E) ELISA data from high salt versus high salt + 1,3-butanediol treated rats (D) and low salt versus high salt fed rats (E), for comparisons of serum IL1β.
(F) Same legend as (A)–(C) for Lcn2.
(G and H) ELISA data from high salt versus high salt + 1,3-butanediol treated rats (G) and low salt versus high salt fed rats (H) for comparisons of serum Lcn2; *p ≤ 0.05; **p < 0.01, ***p < 0.001.

