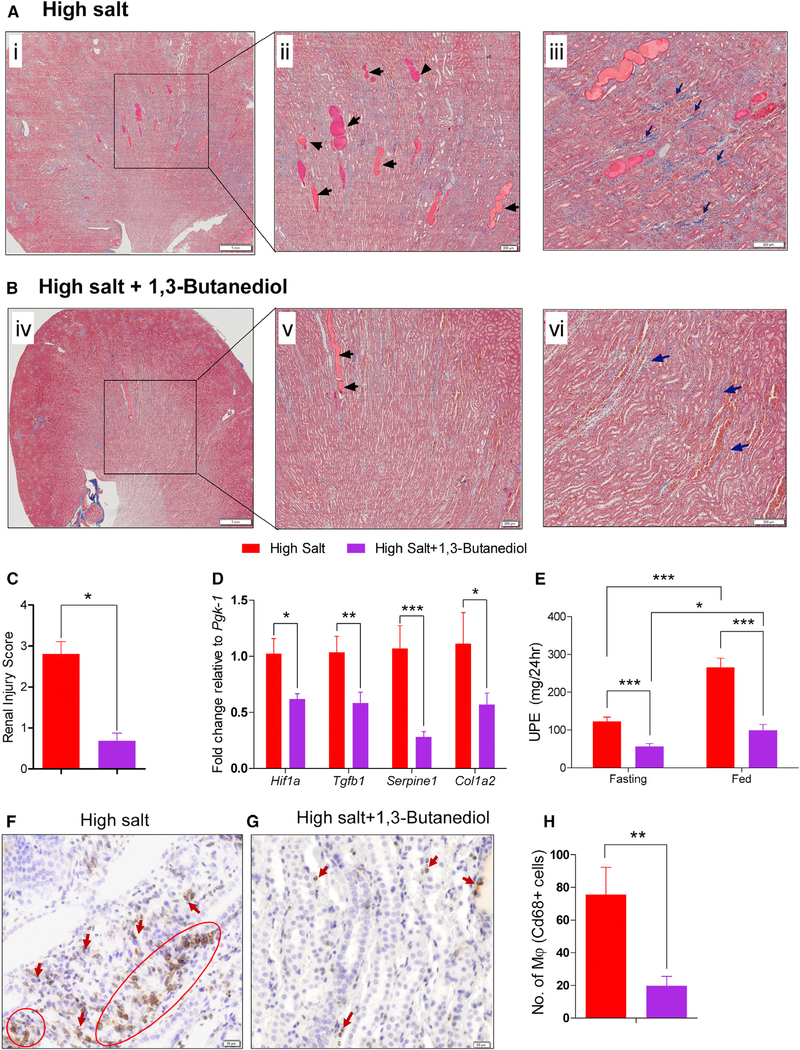
Figure 7. Remission of Kidney Fibrosis, Protein Casts, and Urinary Proteinuria in Rats Treated with βOHB.
(A and B) Kidney sections of high salt-fed rats treated without (A) or with (B) 20% v/v of 1,3-butanediol were stained with Masson’s trichrome. Left: i and iv displays the images at low magnification (8×). The boxed regions in the left panel were further magnified (40×) into the right panel (ii and v). Black arrows in (ii) and (v) indicate protein casts; dark blue arrows in (iii) and (vi) denote blue staining for collagen.
(C–E) Bar graphs show quantitation of renal injury (n = 4/group) (C), mRNA level of genes encoding for cellular stress and tissue fibrosis (n = 8/group) (D), and UPE (urinary protein excretion) (E).
(F and G) Representative images (200× magnification) of kidney sections of high salt fed rats (F) and high salt + 1,3-butanediol fed rats (G) display immunostaining for macrophages (Cd68, brown color). Arrows indicate the infiltration of macrophages in kidney sections.
(H) Quantitation of macrophage numbers. Numbers are counts of macrophages; n = 10. 10× magnification fields/group. Values are expressed as mean ± SEM (*p < 0.05, **p < 0.01, ***p < 0.001).

