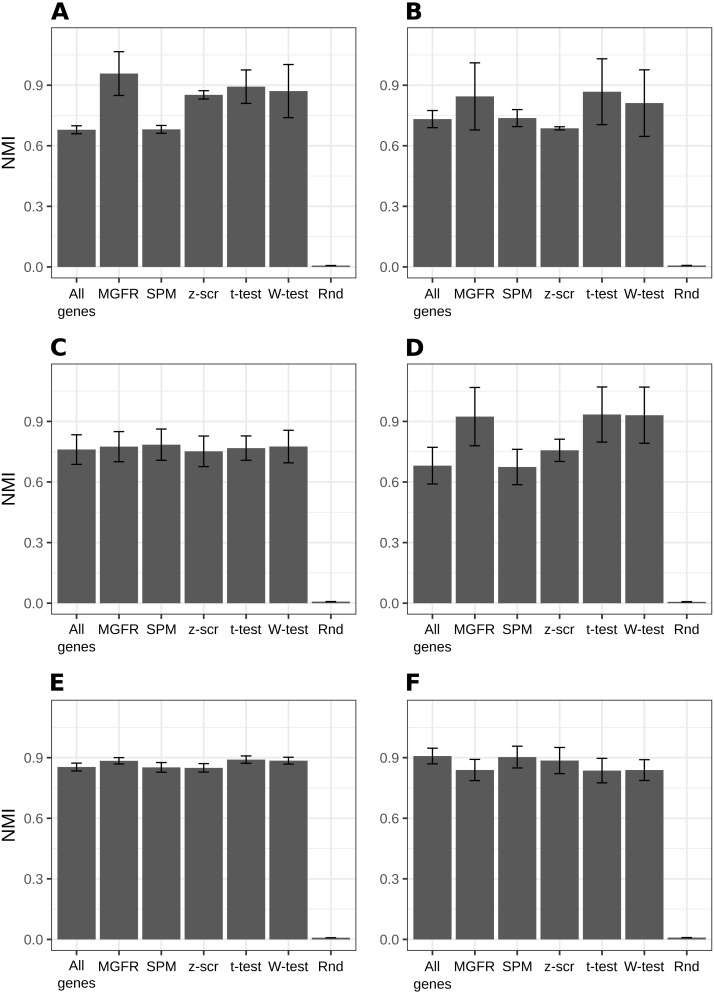
Figure 2. Benchmarking MGFR against other marker detectors.
The biomarkers identified by MGFR lead to clustering results that are as good as or better than those achieved by other methods according to the NMI metric (SPM: Specificity Measure, z-scr: z-score, t-test: pairwise t-tests; Wilcoxon-test: pairwise Wilcoxon rank sum tests, Rnd: Random). Error bars correspond to standard deviations. (A) Primordial, (B) Blastocyst, (C) Embryo, (D) Myogenesis, (E) Tissues and (F) Immune datasets.

