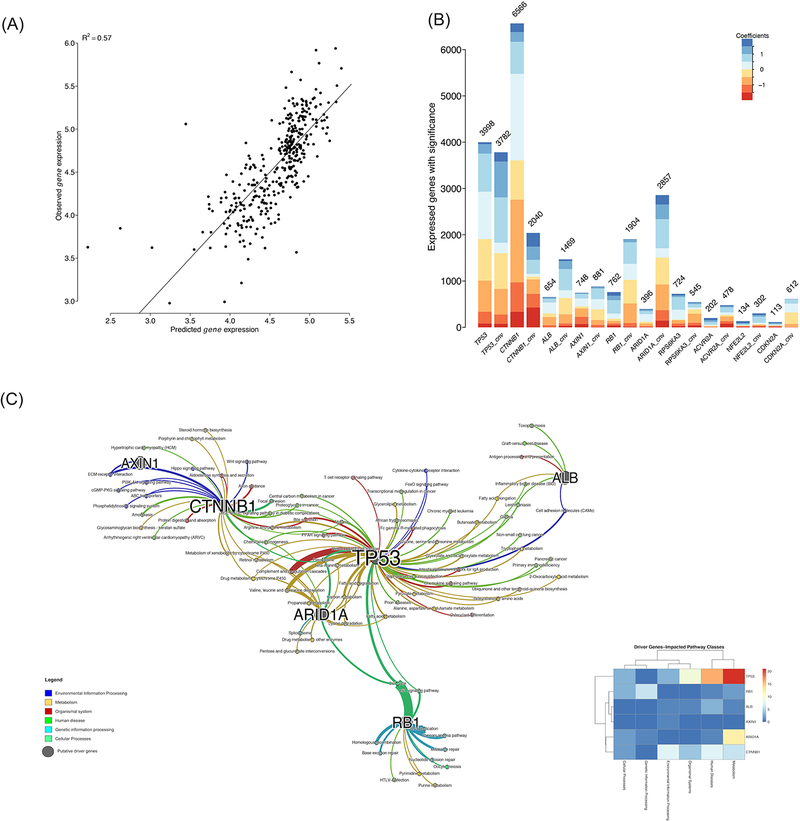
Figure 3: Associations of consensus driver genes with mRNA expression.

(A) Correlation between observed and predicted gene expression. (B) The number of genes whose expression values are significantly associated with the driver gene mutation/CNV statuses. (C) Enriched KEGG pathways network among significant genes as shown in (B). The thickness of edges is proportional to the -log10 adjusted p-value. r
