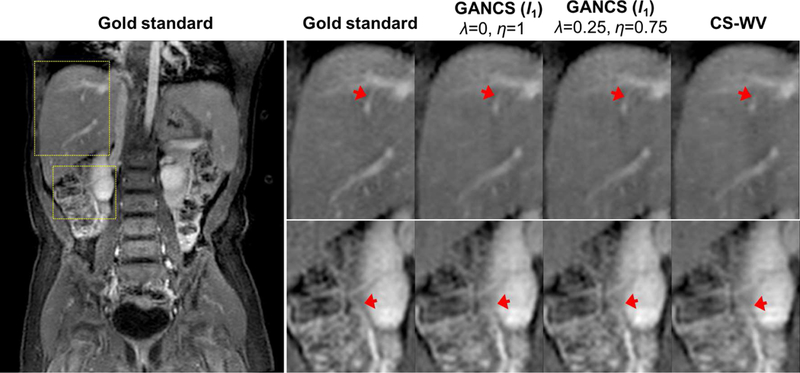
Fig. 5.

Representative coronal images for a representative test patient with 5-fold undersampling. The first column (1th) shows the full view gold standard image, and the rest of columns from left to right indicate the enlarged areas of liver (top row) and kidney (bottom row) for (2th) the gold-standard, and reconstruction under (3th) GANCS with ℓ1-cost (η = 1, λ = 0), (4th) GANCS with ℓ1-cost (η = 0.75, λ = 0.25), and (5th) CS-WV.
