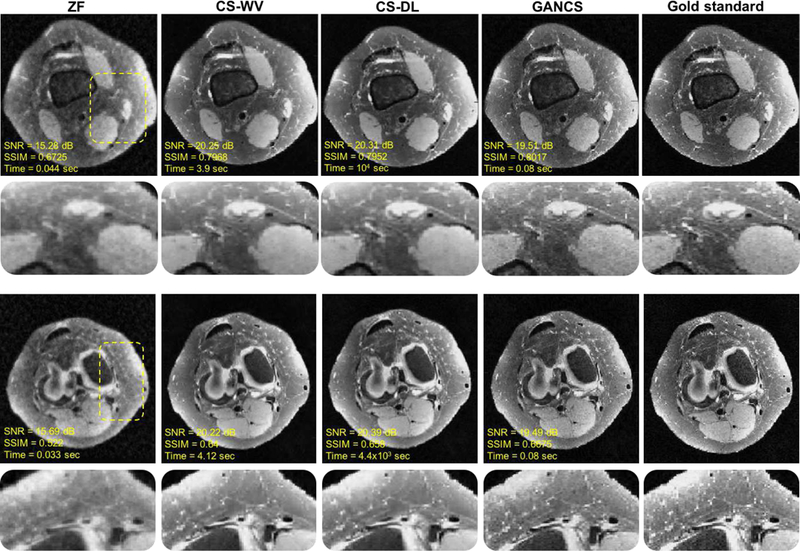
Fig. 6.

Representative axial knee images for a test patient with k-space data acquired under 5-fold variable density sampling with radial view ordering. For GANCS we choose η = 0.99, λ = 0.01. The quantitative metrics are also listed under the images. SSIM is calculated on a window of size 100 × 50 chosen from the image center. GANCS images look sharpest and look more similar to the gold-standard.
