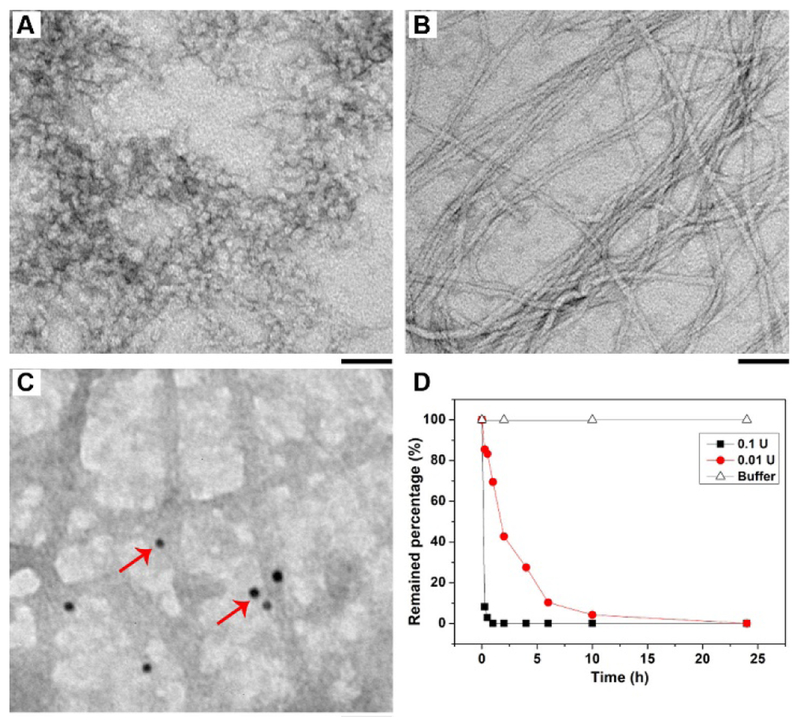
Figure 3.
TEM images of pD1-B at concentration from 0.1 wt% in Tris-Cl buffer (pH = 7.4) (A) without or (B) with the treatment of ALP (1 U/mL). (C) TEM of gold-avidin (10 nm) stained fibers, red arrows point to the gold nanoparticles. Scale bar is 50 nm. (D) Dephosphorylation rate of pD1-B (200 μM) with or without the treatment of ALP (0.1 and 0.01 U/mL) in the Tris-buffer (pH=7.4).

