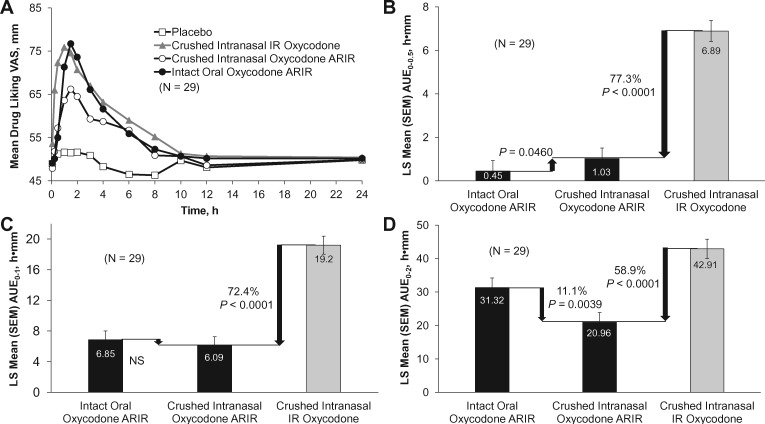
Figure 3.
(A) Mean drug liking over time and early mean drug liking area under the drug curve effect (AUE) (B) over the first 30 minutes (AUE0–0.5), (C) over the first hour (AUE0–1), and (D) over the second hour (AUE0–2). The mean percentage reduction was calculated based on (ci– ti)/|ci – pi| × 100%; i = 1, 2, . . . , n. IR = immediate release; NS = not significant; SEM = standard error of the mean.

