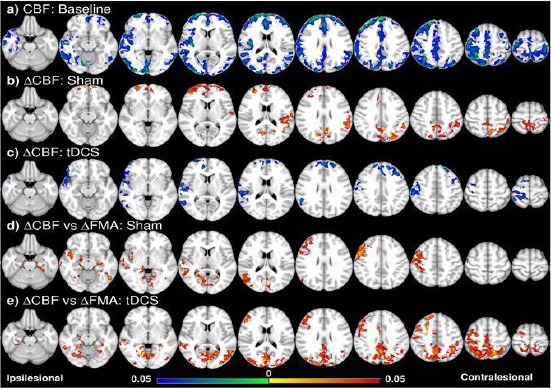
Figure 1.

Voxel-wise CBF analysis and behavioural correlation [13]. (a) CBF of all the patients (tDCS and sham groups together) is lower especially in the ipsilesional hemisphere compared to the control at the baseline. (b) CBF increase in the frontal and contralesional side after training in the sham group. (c) CBF decrease in the frontal and ipsilesional side after training in the tDCS group. (d) ∆CBF positively correlates with ∆FMA in the sham group in the ipsilesional side, including the pre/postcentral cortices, angular gyrus, lateral occipital cortex, and middle temporal gyrus, and the ventral occipital lobes in both sides; (e) in the tDCS group, positive correlation between ∆CBF and ∆FMA is in similar regions as well as the posterior and superior part of the two hemispheres including the posterior parietal cortices. Colorbar represents p-value with hot colour as an increase (or positive correlation) and cold colour as decrease (or negative correlation) (p<0.05, FWE corrected)
