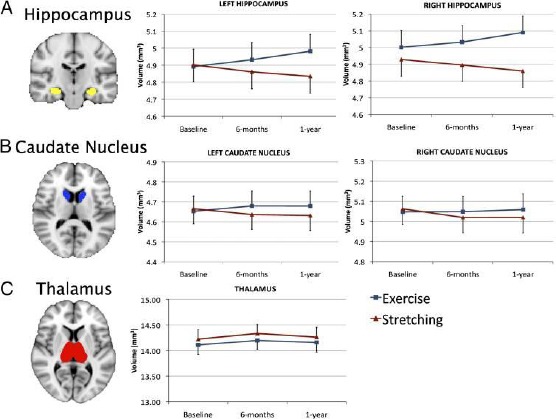
Figure 3.

(A) Example of hippocampus segmentation and graphs demonstrating an increase in hippocampus volume for the aerobic exercise group and a decrease in volume for the stretching control group. The Time × Group interaction was significant (P < 0.001) for both the left and right regions. (B) Example of caudate nucleus segmentation and graphs demonstrating the changes in volume for both groups. Although the exercise group showed attenuation of decline, this did not reach significance (both P > 0.10). (C) Example of thalamus segmentation and graph demonstrating the change in volume for both groups. None of the changes was significant for the thalamus. Error bars represent SEM [17]
