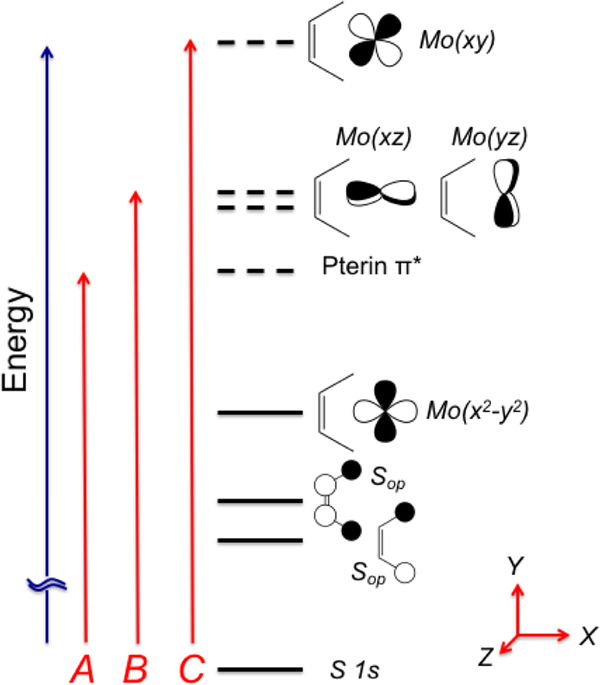
Figure 12.
Energy level diagram for S K-edge XAS analysis that is consistent with bonding calculations for 1 and 2. Solid horizontal lines represent doubly occupied orbitals and dashed horizontal lines represent empty (virtual) orbitals. For 1, the HOMO is the Mo(x2-y2) orbital and the LUMO is a pterin π* orbital. For 2, there are two pterin π* orbitals. Higher energy acceptor orbitals for the S K-edge transitions are to the Mo(xz,yz) orbitals that are Mo≡O π* in nature, and the Mo(x2-y2) orbital which is σ* with the dithiolene S donors. Transitions A-C describe the nature of the S K-edge peaks observed in Figure 12. Note that the z-axis is orthogonal to the plane of the paper.

