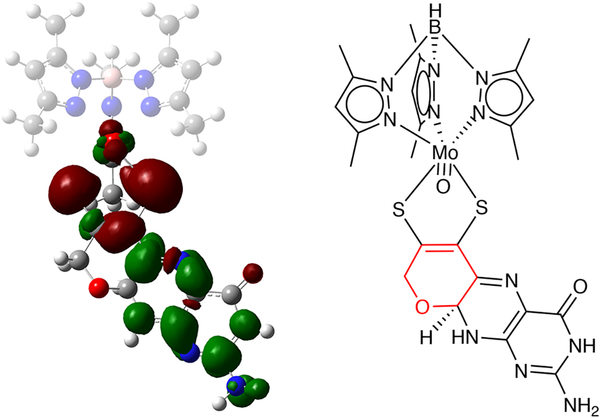
Figure 7.
Electron density difference map (EDDM; isovalue = 0.001) for Band B in 1 derived from TD-DFT pterin calculations showing dominant (74%) Sdithiolene → pterin character. Red regions represent a loss in electron density for the transition and green regions represent a gain in electron density for the transition. The molecule is oriented with the Mo≡O bond out of the plane and toward the reader. The bond line drawing illustrates the computational model, where the two methyl groups on pyran ring are replaced by protons and the pivaloyl group was removed from the amino group.

