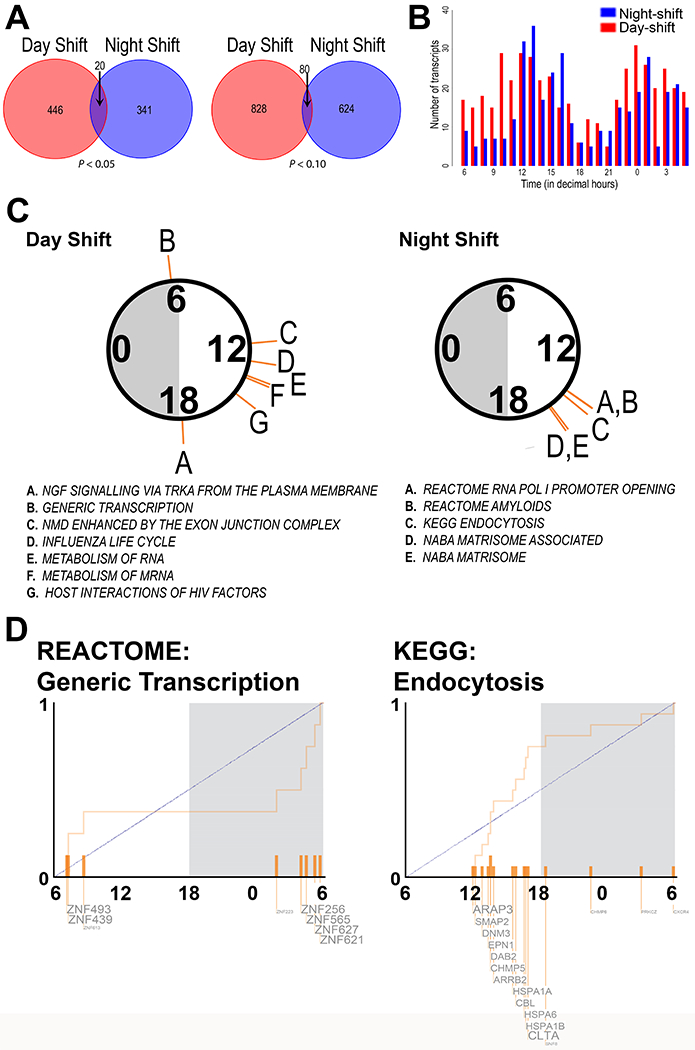
Figure 2.

Circadian transcripts and enriched pathways in day- and night-shift groups
(A) Venn diagram shows MetaCycle’s meta3d reported rhythmic transcripts in day-shift (blue/light gray) and night-shift (red/dark gray) groups with the cut-offs of rAMP > 0.1 and P-value < 0.05 (left) and P-value < 0.1 (right). (B) Phase distribution of circadian transcripts in day (blue/light gray; P-value < 0.05) and night (red/dark gray; P-value < 0.05) shift groups. (C) Significantly enriched pathways (q < 0.05) from PSEA analysis of circadian genes in the Day-shift and Night-shift groups, coded by the letters indicated in the circular plot above each list. Note that 6 am and 6 pm are general markers for day and night, respectively, and that the data were collected at various times of the year. (D) The phase distribution of rhythmic genes is shown for two example pathways.
