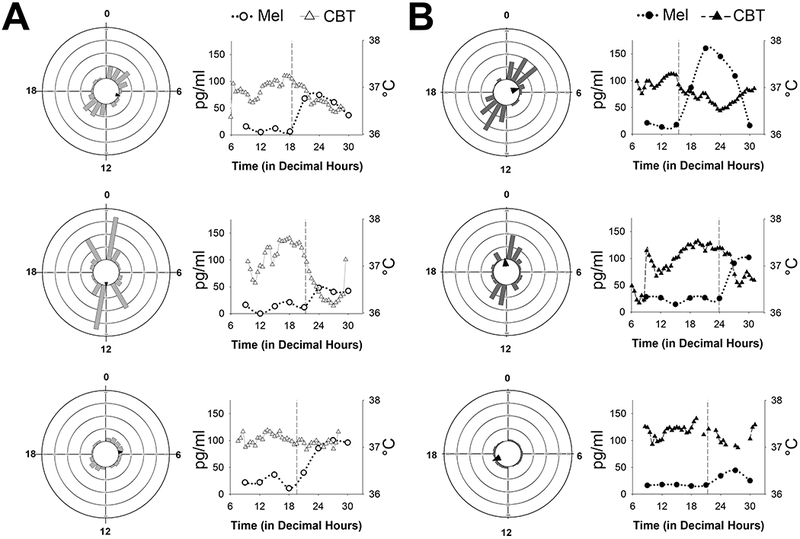
Figure 4.

Phase distributions of circadian transcripts in each individual
Vector histograms of gene expression (left) and melatonin rhythms (right) in three, individual day-shift (A) and three, individual night-shift nurses (B). Each ring represents 75 transcripts, and arrows indicate the average peak time in rhythmic expression (as indicated by the direction). For the line graphs, melatonin is plotted with circles using the left Y-axis and core body temperature (CBT) is plotted as triangles using the right Y-axis. Dim light melatonin onset (DLMO) is indicated by the vertical dashed line in each graph. Cosinor amplitude estimates for CBT are as follows (in °C, top to bottom): panel A (day-shift), 0.269, 0.673, and 0.107; panel B (night-shift), 0.272, 0.422, and 0.114.
