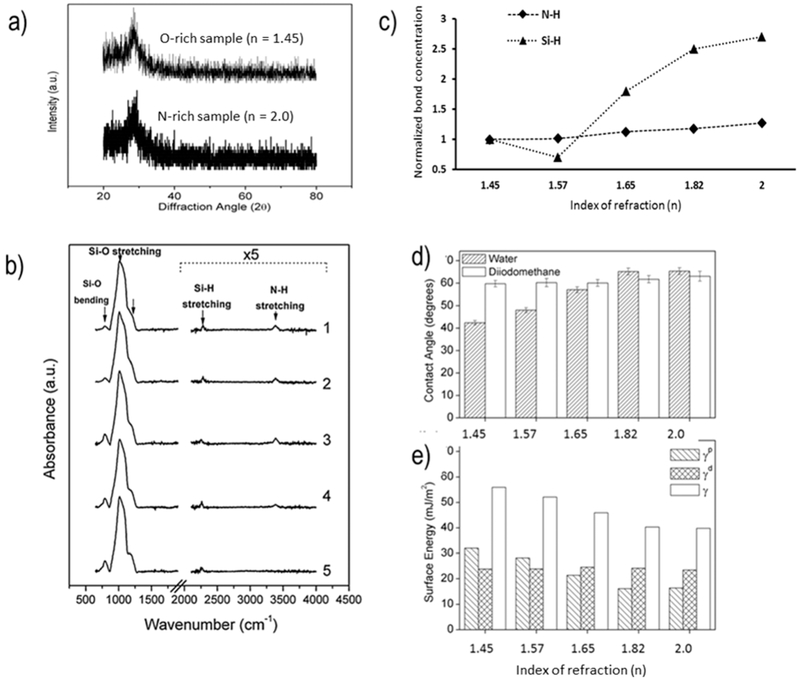
Figure 4.
Surface characterization of PECVD Si–O–N films. (a) X-ray diffraction results indicating the presence of amorphous silica-based films. (b) FTIR spectra of Si–O–N films with the Si–H and N–H spectral contribution magnified. (c) Plot of normalized N–H and Si–H bond concentration as a function of refractive index. The concentrations of N–H (0.128 × 10²² atoms cm−3) and Si–H (1.8 × 10²² atoms cm−3) on amorphous silica surfaces (n = 1.45) evaluated by FTIR-ATR in this work were used to illustrate the relative change in these bond concentrations for higher refractive index samples. (d) Sessile drop contact angle of water and diiodomethane. (e) Calculated surface energy of samples, broken into polar γp and dispersive γd components. The dispersive component is relatively constant, while the polar component decreases with increasing nitrogen content.

