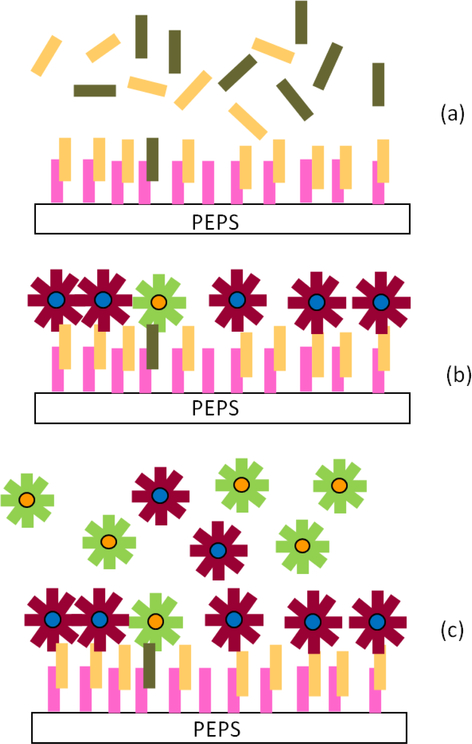
Fig. 10.
A schematic of (a) a mixture of MT and WT flowing over the PEPS coated with pDNA, (b) a mixture of MT FRMs and WT FRMS flowing over the PEPS following detection in the MT/WT mixture, and (c) the MT FRMs and WT FRMs bound on the PEPS after PBS washing to be visualized under a fluorescent microscope.

