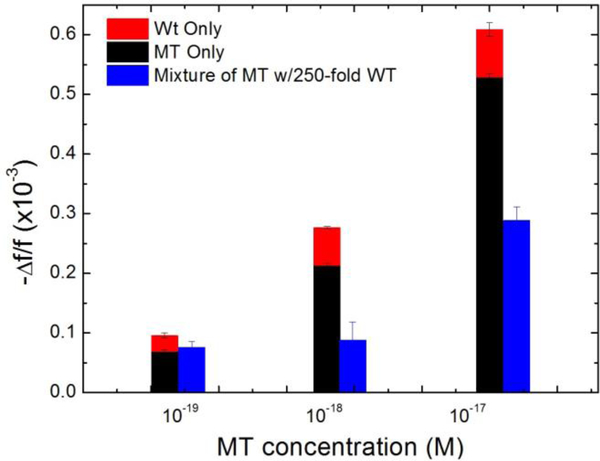
Fig. 11.
-Δf/f for detection of pure MT, pure WT and mixtures of MT and 250 fold more WT in urine from t =0 min to t=30 min averaged over t = 25–30 min from Fig. 5c Fig. 5f and Fig. 7. Average frequency shifts of pure MT and 250-fold more pure WT are added together and compared with the average frequency shifts of mixtures of the concentrations.

