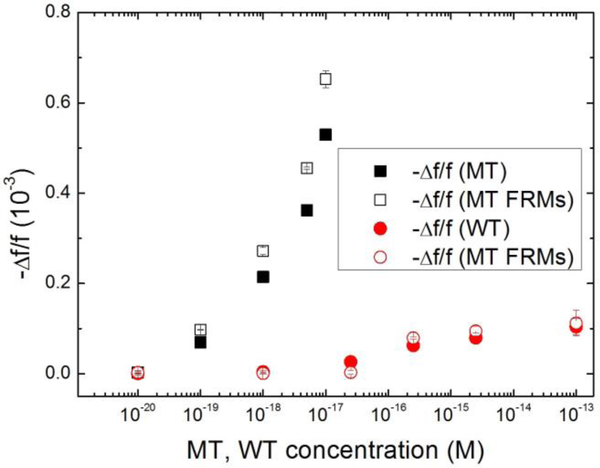
Fig. 6.
-Δf/f for detection of spiked MT (full squares) in urine from t =0 min to t=30 min averaged over t = 25–30 min from Fig. 5c and that for detection of spiked WT (full circles) in urine taken from Fig. 5f versus the MT or WT concentration and -Δf/f from t =30 min to 60 min averaged over t = 55–60 min of MT FRMs detection following MT detection in urine (open squares) taken from Fig. 5c and WT FRMs detection following the WT detection in urine (open circles) taken from Fig. 5f. Clearly, the detection -Δf/f of 0.076×10⁻³ for MT at 100 zM (10−19M) at t = 30 min was still more than three times larger than the detection -Δf/f of 0.025×10⁻³ of WT at 25 aM (2.5×10⁻¹⁷M) or 250-fold that of MT at t = 30 min, (-Δf/f <01×10−3), indicating MT detection could be specific even at zM MT concentrations against more than two-orders-of-magnitude more WT.

