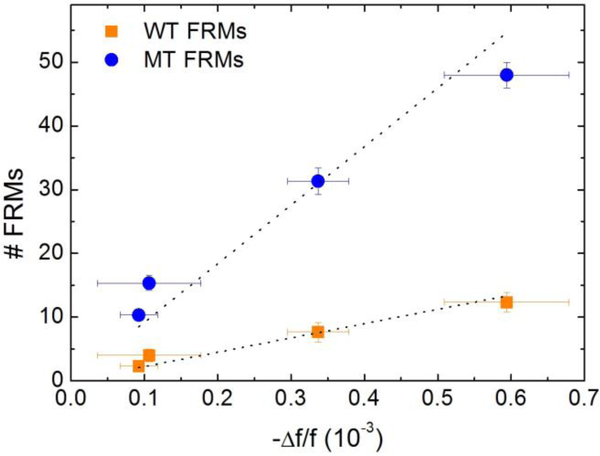
Fig. 9.
Number of MT FRMs (blue full circles) and that of WT FRMs (orange full squares) obtained from Fig. 8 versus average PEPS MT detection -Δf/f at t = 25–30 min taken from Fig 7. Note for each MT concentration the number of MT FRMs (blue) was still roughly 4 times higher than that of the WT even the concentration of the WT was 250 times higher than that of the MT. This indicates that in each case more than 80% of the detection Δf/f was due to the binding of the MT and that PEPS’s MT detection was specific even the concentration of the WT was 250 times higher than that of the MT.

