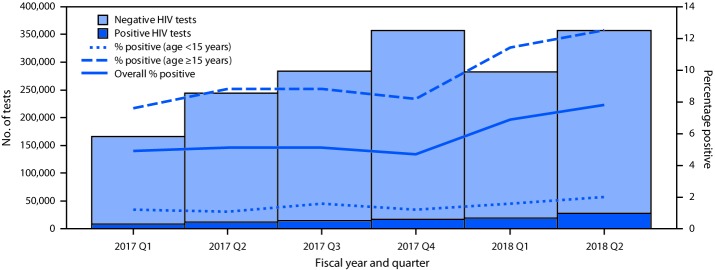
FIGURE.
Percentage of quarterly human immunodeficiency virus (HIV) index tests with HIV-positive results, overall and by age group — 20 countries,* October 1, 2016–March 31, 2018
* Botswana, Cameroon, Côte d’Ivoire, Democratic Republic of the Congo, Eswatini, Ethiopia, Haiti, Kenya, Lesotho, Malawi, Mozambique, Namibia, Rwanda, South Africa, South Sudan, Tanzania, Uganda, Vietnam, Zambia, and Zimbabwe.

