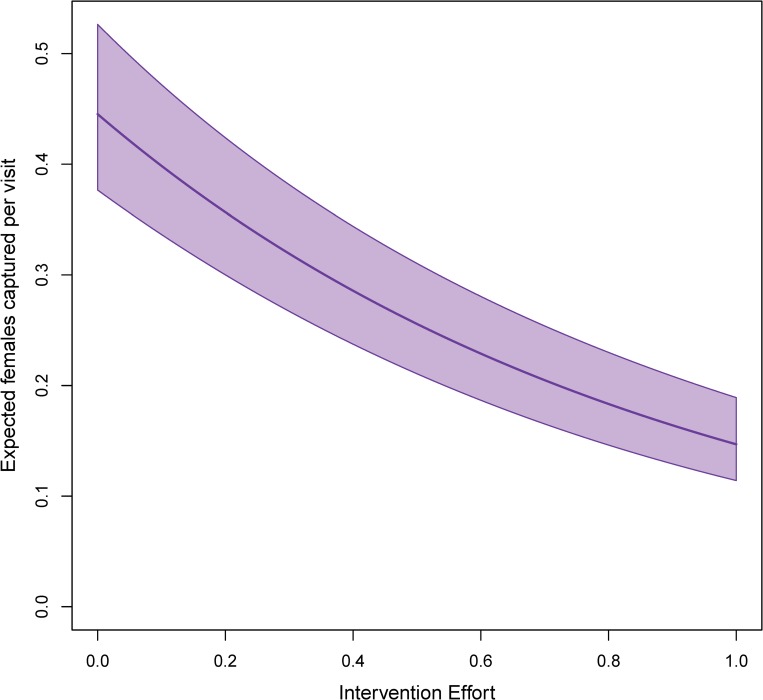
Fig 7. Dose-response curve for the Ministry of Health space-spray intervention.
Expected changes in number of female Ae. aegypti captured with 95% uncertainty as a function of impact of various levels of intervention effort on a home in the center of the city measured on April 28th, 2001. Here, ‘intervention effort’ is defined as the fraction of all houses in a MOH zone that were sprayed sometime in the past three weeks. When multiple spray campaigns occurred in the previous three weeks, the maximum fraction of spayed houses across campaigns was taken as the intervention effort. These choices (home in the center of the city, the date of April 28th, 2001) are all arbitrary but necessary to account for spatial and temporal variation.

