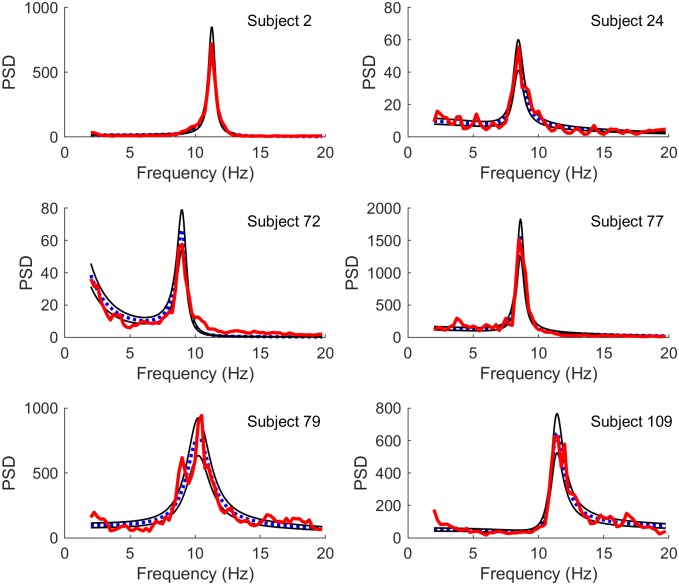
Fig 1. Best fits using least squares.
Comparison of model spectra (blue dotted line) fit to experimental spectra (red thick line) by least squares (LS) minimization using particle swarm optimization, for a select set of subjects. Also shown are the 16% and 84% quantiles based on the gamma distribution for the fitted spectra (thin black lines). The subjects have been selected to show the range of spectra included in the full data set. A comparison of the experimental time series with representative samples of modelled time series for the same subjects is included in S1 Fig.

