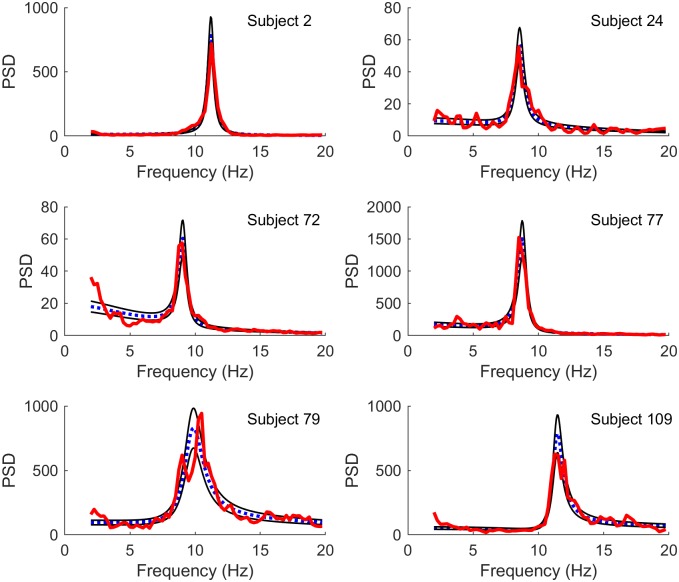
Fig 2. Best fits using maximum likelihood.
Comparison of model spectra (blue dotted line) fit to experimental spectra (red thick line) by maximum likelihood (ML) estimation using MCMC. Also shown are the 16% and 84% quantiles (thin black lines). The subjects are the same as in Fig 1. It should be noted that LS and ML fits are expected to differ in this case, since the LS fits are more sensitive to deviations in the unweighted spectral power (typically in regions with larger power) whereas the ML fits are more sensitive to deviations in regions where the variance of spectral power is small (typically in regions of lower spectral power).

