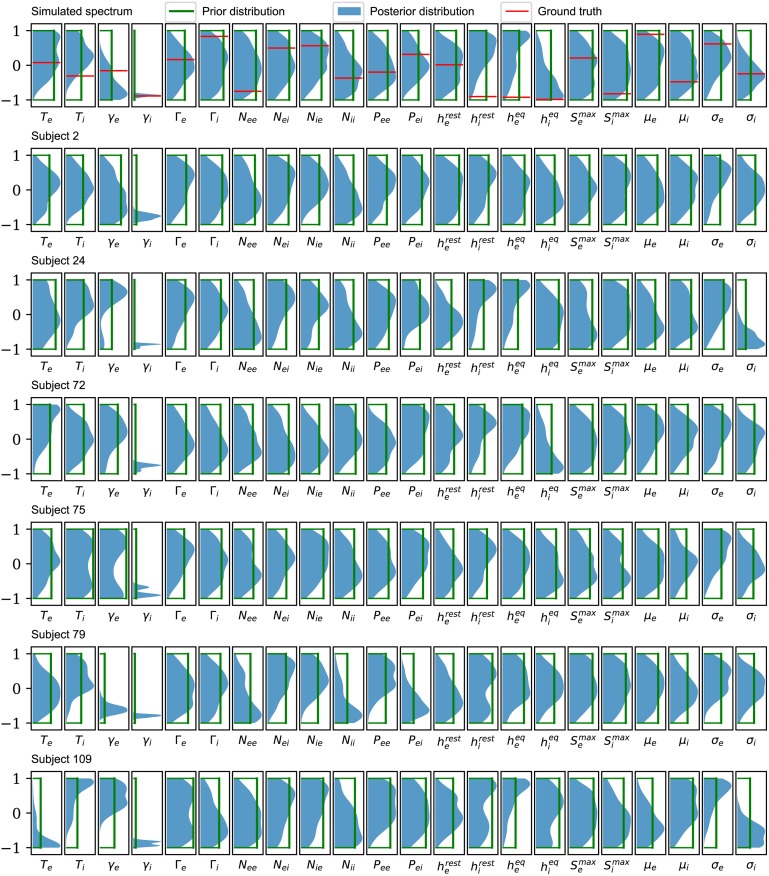
Fig 3. Posterior distributions based on PSO sampling.
Comparison of the posterior (solid color) and prior marginal (green line) distributions for the selected subjects used in Figs 1 and 2. For the simulated spectrum (first row), the distributions of the parameters are presented against the ground truths for the corresponding parameters (red line). The distributions are based on kernel density estimates from the best 100 of 1000 randomly seeded particle swarm optimizations for each subject. The seeds are uniformly distributed over the allowed parameter ranges. The major result is that, across the full set of 82 subjects, only the parameter γi is significantly constrained. All other parameters have nearly the same uncertainties as the prior.

