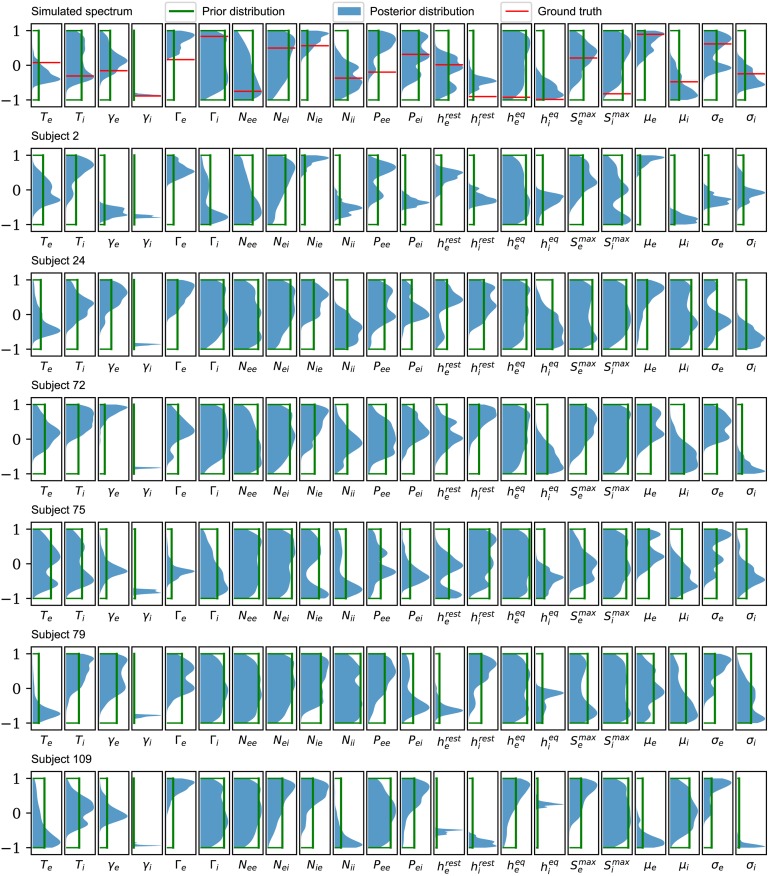
Fig 4. Posterior distributions based on MCMC sampling.
Comparison of the posterior marginal distributions (solid color) with the prior marginal distributions (green line) for the selected subjects used in Figs 1 and 2. For the simulated spectrum (first row), the distributions of the parameters are presented against the ground truths for the corresponding parameters (red line). Each distribution is based on a kernel density estimate from 1000 samples (sub-sampled from 106MCMC samples). Consistent with the conclusions from PSO sampling, only γi is consistently constrained by the data when viewed across all subjects.

