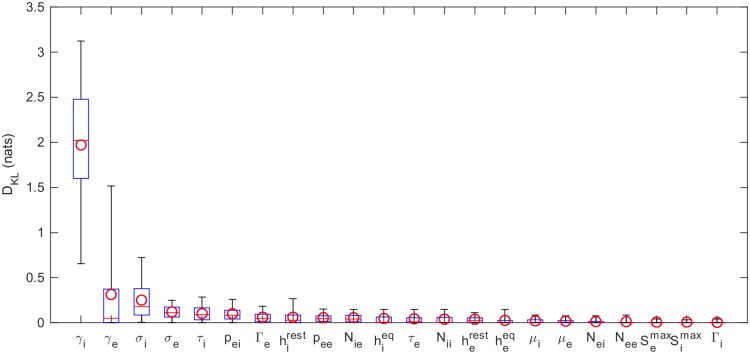
Fig 5. KLDs based on PSO samples.
Kullback-Leibler divergences of marginal posterior parameter distributions calculated relative to uniform prior distributions. The posteriors are based on the best 100 of 1000 randomly seeded runs of particle swarm optimization (see Fig 3). The boxes represent the 25% and 75% quartiles; the whiskers represent the 5% and 95% quantiles; the red lines show the median KLDs and the circles the mean KLDs over the full set of 82 subjects.

