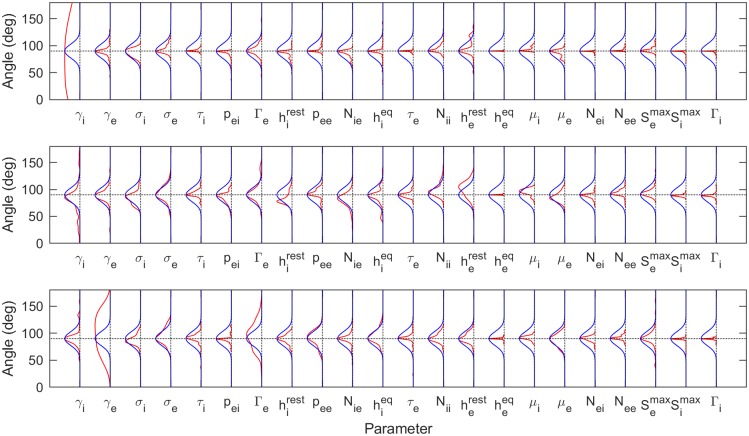
Fig 9. Contributions to the eigenvectors corresponding to 1st, 2nd and 3rd eigenvalues based on LS best fits.
Alignment of the leading eigenvectors relative to each parameter. 0° and 180° represent perfect alignment (maximum contribution) whereas 90° represents orthogonality (no contribution). To compare the 82 subjects, results are presented as angular distributions (red lines). The first row is for the largest eigenvalue, the second row for the second-large eigenvalue, etc. The blue lines show the expected angular distributions for a randomly pointed vector in the 22-dimensional parameter space, illustrating how these are most likely to be orthogonal to any parameter direction. The angles are the inverse cosines of the direction cosines of the vectors. The distributions indicate that the parameters γi and (to a lesser extent) γe may play significant roles in determining the spectral form in their own right. The remaining parameters appear largely in complicated combinations.

