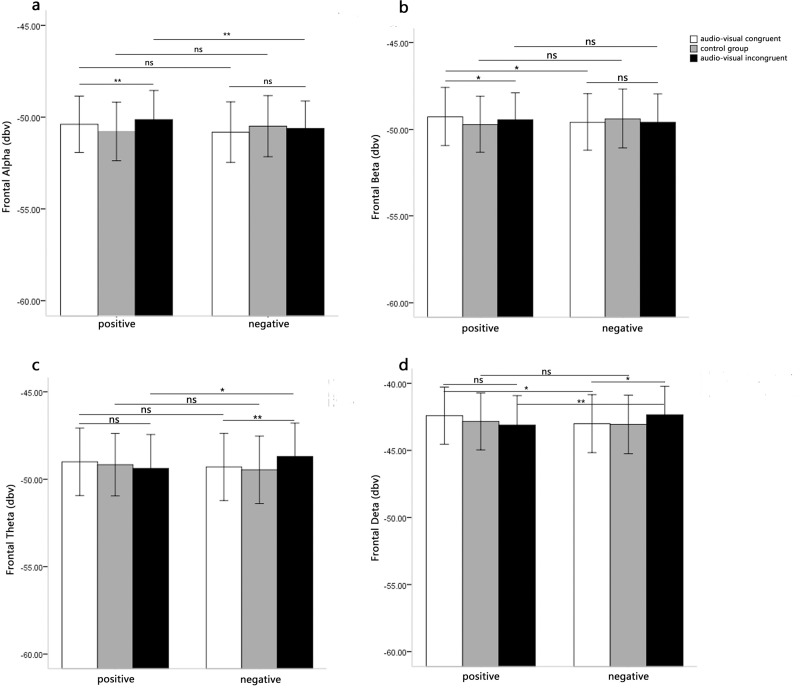
Fig 3. Means EEG power of music-induced emotion as a function of music type and audio-visual congruence.
Fig 3A displays the results of Repeated measures analysis in prefrontal alpha power. Fig 3B displays the results of Repeated measures analysis in prefrontal beta power. Fig 3C displays the results of Repeated measures analysis in prefrontal theta power. Fig 3D displays the results of Repeated measures analysis in prefrontal delta power.

