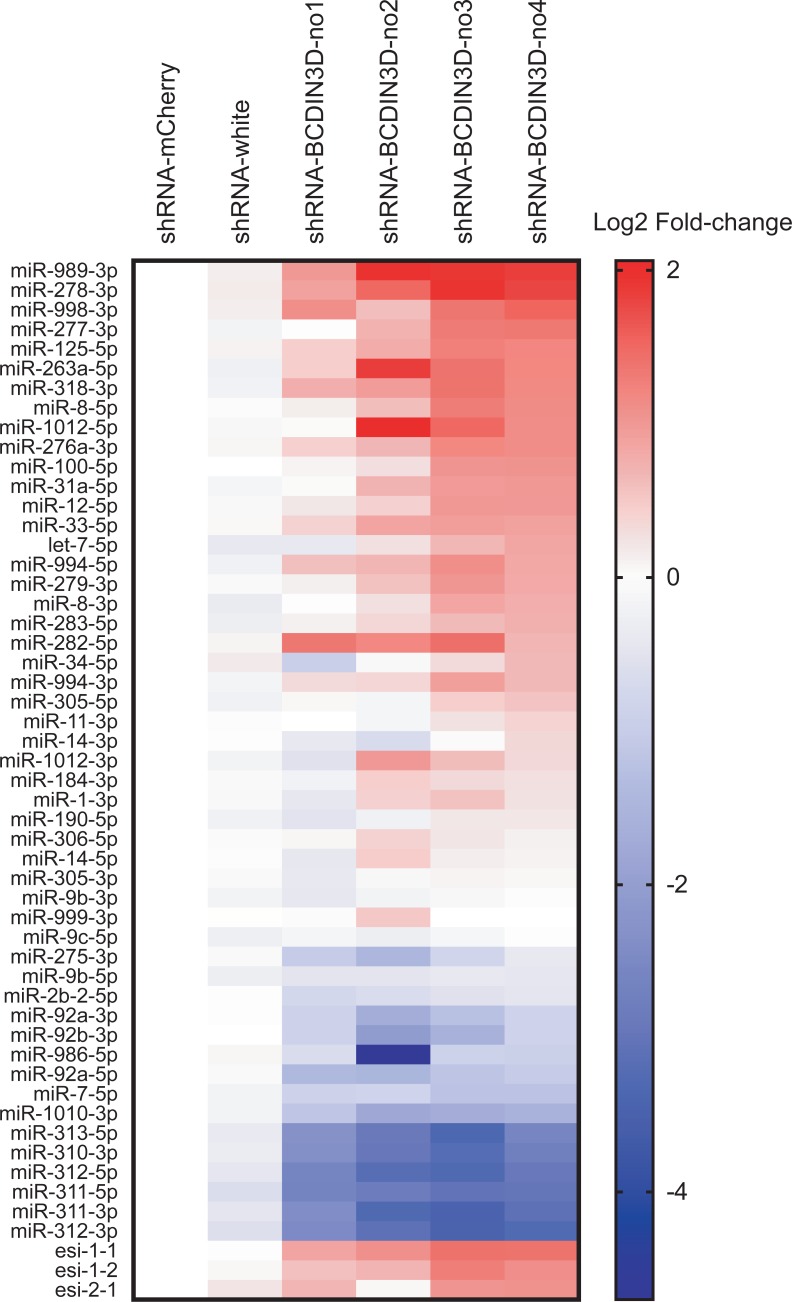
Fig 2. Ovary-specific knockdown of BCDIN3D causes dysregulation of miRNA profile in ovaries.
Heatmap of normalized miRNA and endo-siRNA (esi-1.1, esi-1.2, and esi-2.1) abundance in control and BCDIN3D knockdown ovaries determined by high-throughput sequencing. Mean log2 fold-change of three biological replicates relative to shRNA-mCherry control is shown. miRNAs are sorted in descending order of log2 fold-change in shRNA-BCDIN3D-no4. To eliminate miRNAs with very low expression levels, only miRNAs (n = 50) whose normalized mean abundance was more than 100 reads per million total reads in either of the strains are shown.

