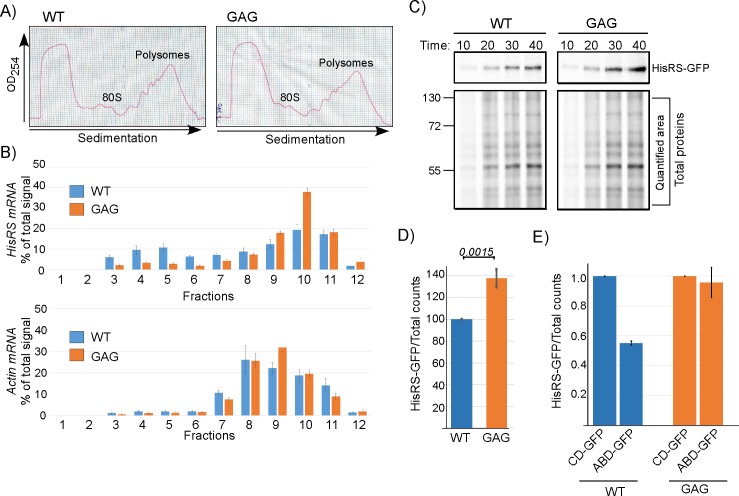
Fig 5. Binding of HisRS to the anticodon mimic represses its translation.
A) Cells expressing either WT HisRS or GAG mutation were subjected to polysomal fractionation on a sucrose gradient. OD254 profiles of the WT and GAG reveal similar polysomal profiles. B) Twelve fractions were collected along the gradients and subjected to northern analysis with either HisRS probe or Actin probe. Histograms presents the quantification of the HisRS mRNA signal (top) and the Actin mRNA signal (bottom) from three independent biological repeats. Error bars represent the standard deviation of percent of signal per fraction. See S6 Table for raw data. C) Cells were pulse labeled with 35S-met and samples were collected at the indicated times. Total protein sample was set aside, and HisRS-GFP was isolated from the remainder by IP. Autoradiogram presents HisRS-GFP signals and Total proteins signals (with the quantified region indicated) from both strains. D) Cells were subjected to a 30-min pulse, and labeled HisRS-GFP was isolated by immunoprecipitation as in C. Signals were normalized to the Total proteins signal. Results are from four independent biological repeats. Error bars represent SEM, and P value was calculated by the dependent samples one-sided t test. See S6 Table for raw data. E) Plasmids expressing the CD-GFP or ABD-GFP were introduced into cells endogenously expressing either the WT or GAG variants of HisRS. Cells were subjected to a 30-min pulse, followed by HisRS immunoisolation as in C. Results are from two independent biological repeats, and error bars are SEM. See S6 Table for raw data. ABD, anticodon-binding domain; CD, catalytic domain; GFP, green fluorescent protein; HisRS, histidyl-tRNA synthetase; IP, immunoprecipitation; OD254, optical density; WT, wild-type.

