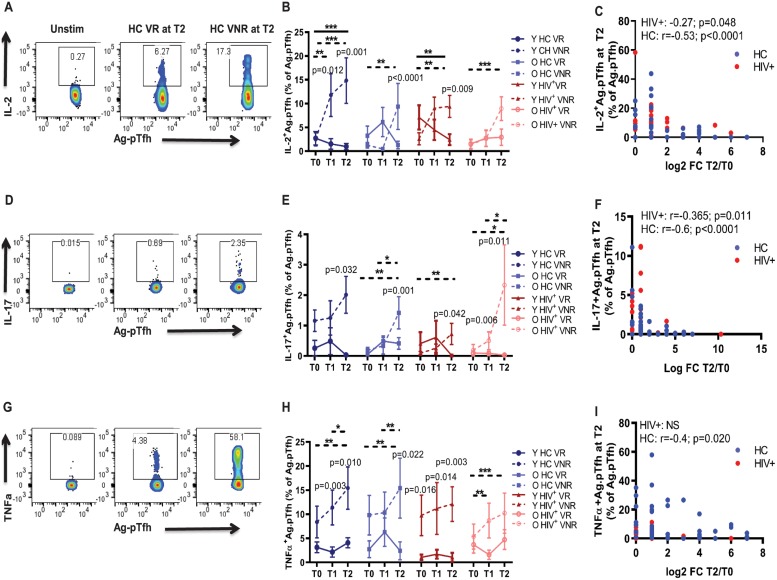
Fig 3. Ag.pTfh in VNRs showed higher production of Tfh antagonistic and inflammatory cytokines at T2.
(A); Flow cytometry plots showing IL-2+Ag.pTfh cells in a young HC VR and VNR. (B) Line graph showing mean frequencies of IL-2+pTfh cells in the study groups. (C) Correlation between IL-2+Ag.pTfh cells at T2 with FC H1N1 Ab titer at T2 including VRs and VNRs together for HCs (blue) and HIV+ individuals (red). (D) Flow cytometry dot plots showing IL-17+Ag.pTfh cells in a young HC VR and VNR. (E) Line graphs showing mean frequencies of IL-17+Ag.pTfh. (F) Correlation between IL-17+Ag.pTfh cells at T2 with FC H1N1 Ab titer at T2. (G) Flow cytometry dot plots showing TNFα+Ag.pTfh cells in a young HC VR and VNR. (H) Line graphs showing mean frequencies of TNFα+Ag.pTfh. (I) Correlation between TNFα+Ag.pTfh cells at T2 with FC H1N1 Ab titer at T2. Statistical analysis was performed to compare study groups and longitudinal analyses using generalized linear mixed models. Horizontal lines (solid for VR, dashed for VNR) indicate significant differences between time points within a group and between groups and the level of significance corresponds to p-values as follows: *p < 0.05; **p < 0.01; ***p < 0.001. p-Values shown within the graph refer to significant difference between VRs and VNRs at indicated time points. For correlation analyses, Spearman correlation coefficient was performed. Underlying data used in the generation of this figure can be found in S1 Data. Ab, antibody; Ag.pTfh, antigen-specific peripheral T follicular helper; FC, fold change; HC, healthy control; IL, interleukin; O HC, old healthy control; O HIV+, old HIV+; Tfh, T follicular helper; TNFα, tumor necrosis factor alpha; Unstim, unstimulated cultures; VNR, vaccine nonresponder; VR, vaccine responder; Y HC, young healthy control; Y HIV+, young HIV+.

