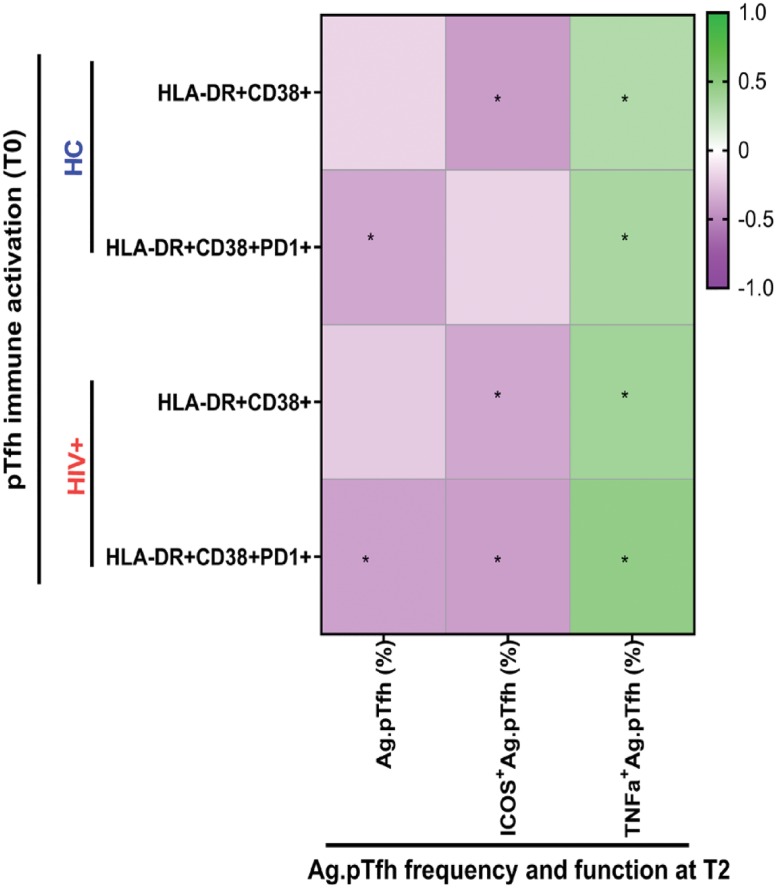
Fig 4. Association of Ag.pTfh frequency and functional markers with baseline immune activation of pTfh cells.
Heatmap showing correlation coefficients between immune activation parameters in bulk pTfh cells at T0 with Ag.pTfh characteristics, including frequency, ICOS expression, and TNFα production at T2. All correlation analysis were performed by including VRs and VNRs together for HC (blue) and HIV + (red) groups. Colored boxes represent correlation coefficient for each comparison, and scale indicates positive r value (green) and negative r values (purple). For correlation analyses, either Pearson or Spearman rank correlation coefficient was performed based on data distribution. *p < 0.05 indicates significant correlations (see also S1 Table). Underlying data used in the generation of this figure can be found in S1 Data. Ag.pTfh, antigen-specific peripheral T follicular helper; HC, healthy control; ICOS, inducible costimulator; pTfh, peripheral T follicular helper; TNFα, tumor necrosis factor alpha; VNR, vaccine nonresponder; VR, vaccine responder.

