
Fig 1. Comparison of WaferGen ARG 2-ΔCT values with MinION ARG counts (hits) with reference to the 16S rRNA gene.
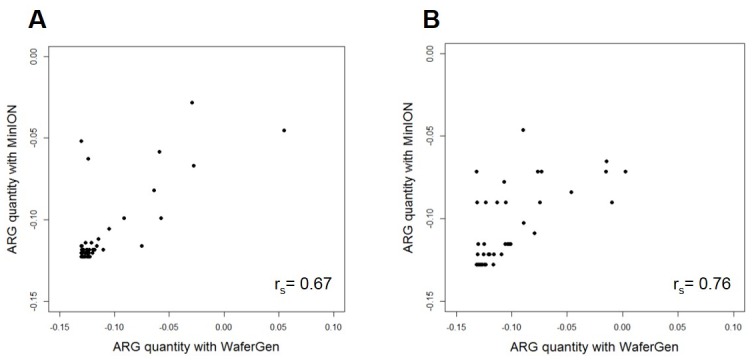
(A) ICU cages (B) Laundry Trolley. X axis: normalised differences in 2-ΔCT values of ARGs when compared to 16S rRNA 2-ΔCT value obtained with WaferGen; Y axis: normalised differences in counts of ARGs when compared to the 16S rRNA count obtained with program ABRicate using MinION sequence data.