
Figure 2: THOC most severely affects DA synapses.
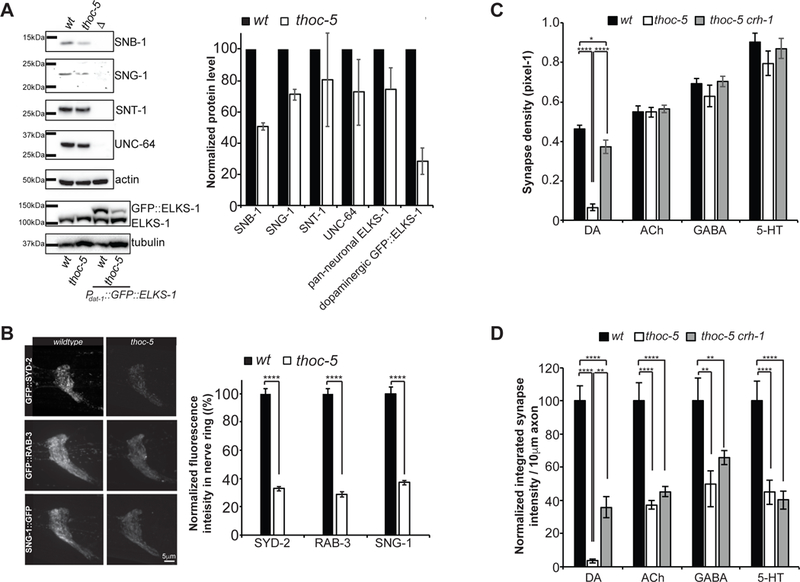
(A) Quantitative western blotting of endogenous, pan-neuronally expressed presynaptic proteins. Representative blot images and quantification of 3 independent experiments is shown.
(B) Endogenous GFP knock-in strains for SYD-2, RAB-3 and SNG-1. Representative images of the nerve ring is shown for wt and thoc-5. Quantification of total nerve ring fluorescence is plotted. N=10–20. ****, p<0.0001, student t-test.
(C) Synapse density quantification for different neuron types in wt, thoc-5 and thoc-5 crh-1.
(D) Quantification of normalized integrated synaptic intensity for different neuron types in wt, thoc-5 and thoc-5 crh-1.
N=10–20 animals at L4; ****, p<0.0001; **, p<0.01, one-way Anova with Tukey post-hoc test for (C) & (D)
DA: Dopamine, Ach: Acetylcholine, GABA: γ-aminobutyric acid, 5-HT: SerotoninAverages and SEM are plotted.