Figure 1.
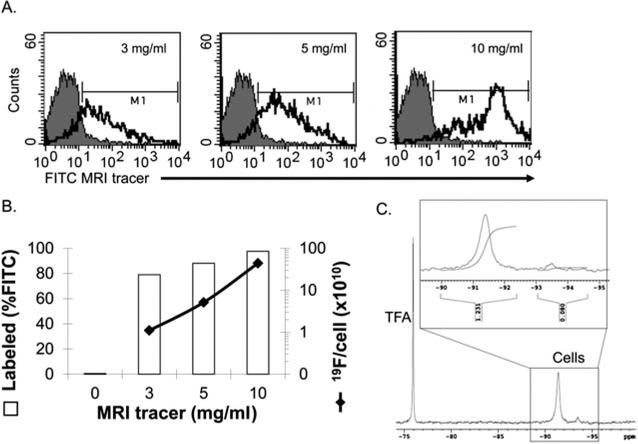
Labeling efficiency of CD34+ hematopoietic stem cells (HSCs) with 19F MRI tracer. (A) Human bone marrow (BM) CD34+ cells were incubated with increasing doses of fluorescein isothiocyanate-magnetic resonance imaging (FITC-MRI) tracer to optimize labeling efficiency by flow cytometry. Autofluorescence in control cells is represented by the gray-filled histograms and the green fluorescence in MRI tracer labeled cells is indicated by the unfilled histograms (one of three experiments with similar results). (B) Average labeling efficiency versus increasing dose of MRI tracer. Left axis, open bars: percentage of the CD34+ cell population containing label as measured by flow cytometry fluorescent signal above background (denoted by M1 in A); right axis, solid line, perfluorocarbon (PFC) label uptake measured by 19F nuclear magnetic resonance (NMR). (C) Representative NMR spectra of 10 mg/ml MRI tracer labeled CD34+ cells corresponding to a 4.4 × 10¹¹ 19F atoms/cell labeling efficiency (one of three experiments with similar results). An inset depicts a typical integration curve, with the peak at −91 ppm used for labeling efficiency calculations.

