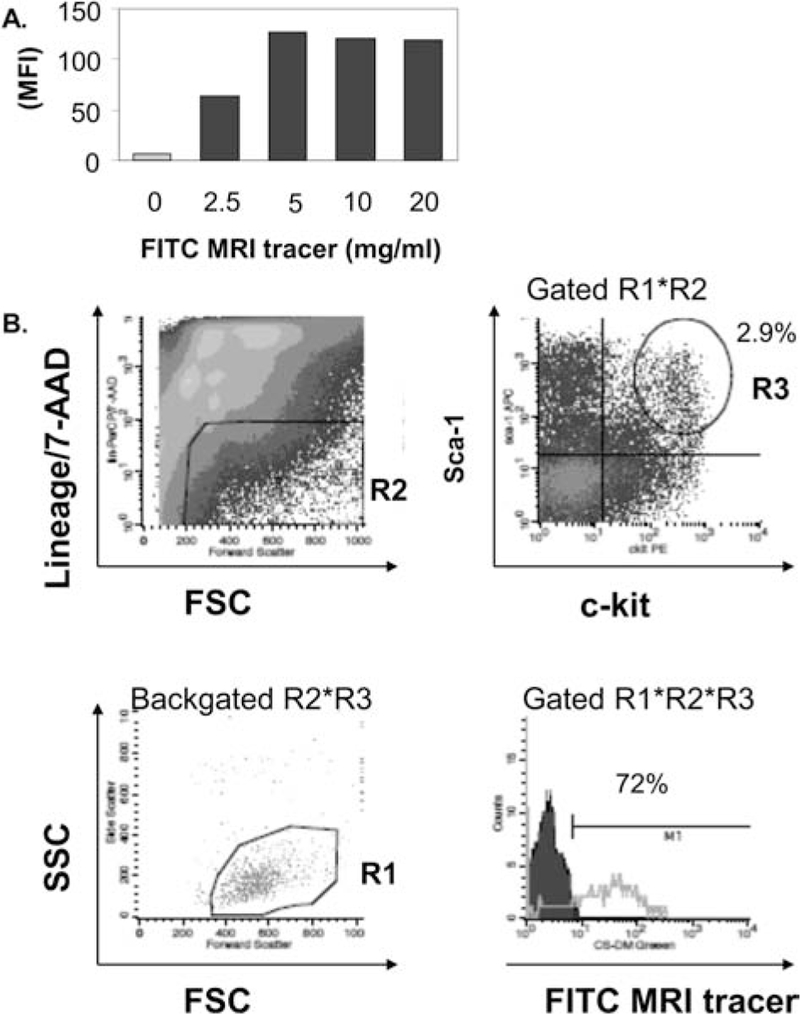
Figure 5.
MRI tracer labels murine bone marrow HSCs. (A) Increasing doses of FITC-MRI tracer was incubated with murine bone marrow mononuclear cells and then evaluated by flow cytometry. (B) Labeling of murine HSCs present in bone marrow was confirmed by flow cytometry. Gating strategy for enumeration of labeled HSCs is depicted and included selection of live cells by forward scatter (FSC) and side scatter (SSC) (R1), exclusion of dead 7-aminoactinomycin D (7-AAD)+ and peridinin-chlorophyll-protein complex (PerCP)-labeled lineage (lin)+ cells in the FL-3 channel (R2), and gating double-positive c-kit+ stem cell antigen (Sca)-1+ BM cells in FL-2 and FL-4 channels, respectively (R3), to examine live, 7-AAD− lin− Sca-1+ c-kit+ cells for the presence of FITC-MRI tracer (detected in FL-1 channel), lower right plot. One of three independent experiments with similar results is shown. Backgated R2*R3 scatter plot is provided to verify selection of the correct HSC population in lower left plot. MFI, mean fluorescence intensity.

