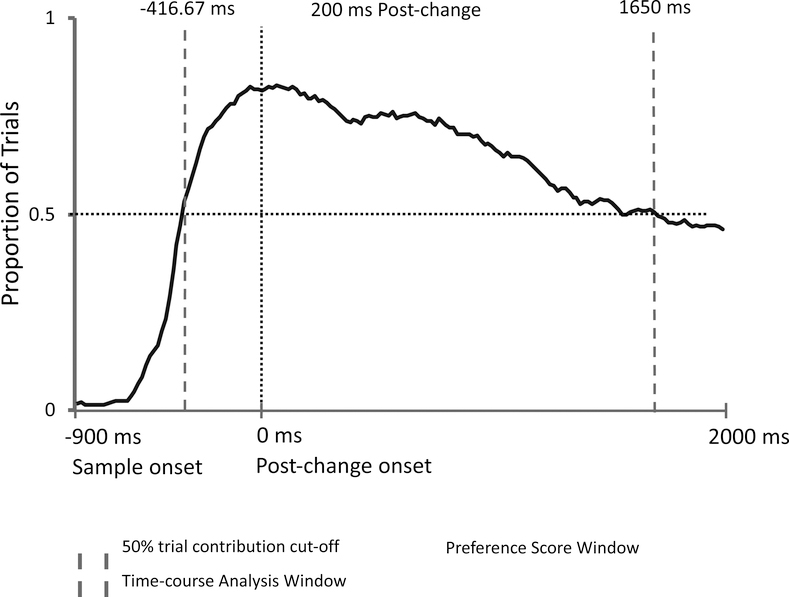
Figure 6.
Proportion of trials across all infants in Experiment 2 which gaze was directed to one of the two objects at each sample point (and therefore contributed data that could be used to assess the preference for the changed object). The lighter horizontal dotted line indicate the 50% cut-off. The vertical dotted line indicates the point in the trial where the change occurs (post-change phase onset). The solid dark line reflects the proportion of trials with observed data. The thick broken vertical lines indicate the first and last points at which at least 50% of all trials had fixations recorded to one or the other item (the other trials had fixations directed to other locations on the screen or off the screen altogether). These lines also indicate the analysis window for the Monte Carlo time-course analysis (see text). The analysis window for the preference score is shown in the shaded area, which begins 200 ms after the post-change onset and ends at the end of the analysis window.

