. 2019 May 16;8:e43362. doi: 10.7554/eLife.43362

Figure 1. LISP2 marks the beginning of hepatic stage development.

(A) Schematic structure of the LISP2 gene showing the N-terminal signal peptide, 6-cys domain and epitope (highlighted in black) used as immunogen to raise antibodies against P. cynomolgi and P. vivax LISP2 protein (B) Immunofluorescence assay, IFA of P. cynomolgi liver stage parasites in infected simian primary hepatocytes showing liver stage development from day 1 to day 12 post-infection visualized with DAPI for DNA content (blue), a polyclonal antibody specific for P. cynomolgi HSP70 protein (green) and a monoclonal antibody specific for P. cynomolgi LISP2 protein (red); Scale bar, 35 µm. From day 3 onwards, LISP2 staining observed in a crescent shape asymmetrically located on one side of earliest developing parasites (LISP2+). By day 5, LISP2 accumulates in peripheral vacuolar membrane structures in multinucleate schizonts and does not co-localize with DAPI or HSP70 (LISP2++).

Figure 1.

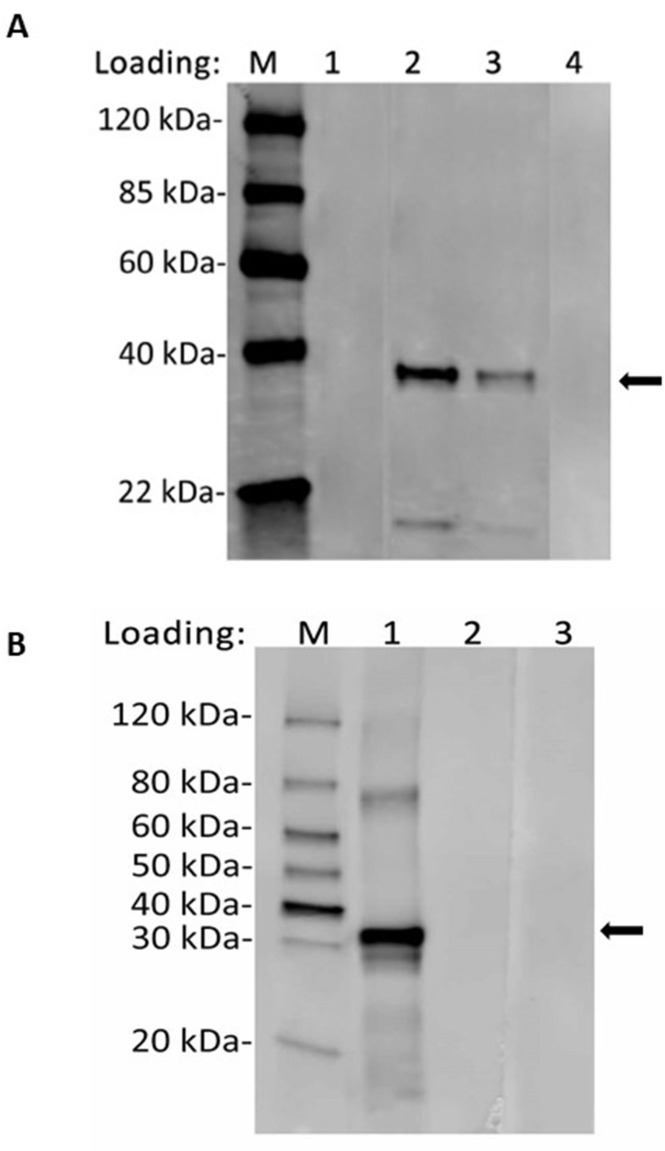
Figure 1—figure supplement 1. Recognition of recombinant LISP2 antigen with purified anti-LISP2 monoclonal antibody by western blot.

Figure 1—figure supplement 1.

(A) Lane 1, 2 and 4 were loaded with 100 ng of LISP2 antigen, whereas lane 3 with 50 ng of antigen. Lane 2 and lane 3 were probed with anti- PcyM_0307500 (1 µg/ml) and show correct protein band (molecular weight 37 kilodalton), whereas lane 1 was probed with pre-serum and lane 4 represents blank. (B) Lane 1, 2 and 3 were loaded with 100 ng of LISP2 antigen. Lane 1 was probed with anti- PVP01_0304700 (1 µg/ml) show correct protein band (molecular weight 36.3 kilodalton), whereas lane 2 probed with pre-serum and lane 3 represents blank.
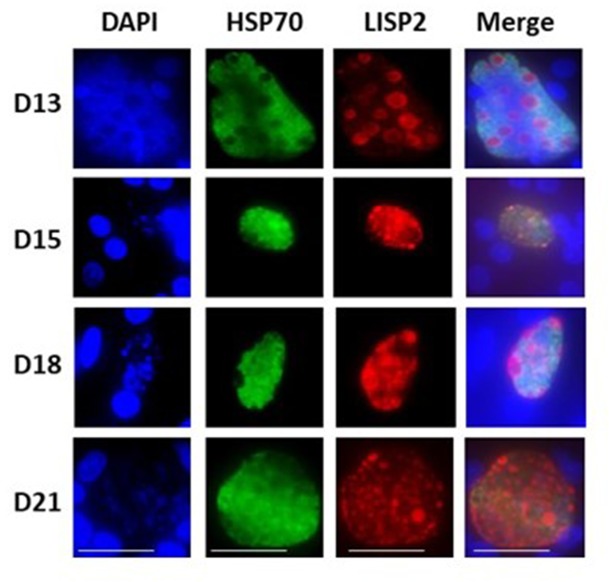
Figure 1—figure supplement 2. LISP2 expression in liver stages beyond 13 days post-sporozoite infection.

Figure 1—figure supplement 2.

IFA of liver stage parasites in infected simian primary hepatocytes showing liver stage progression at day 13, day 15, day 18 and day 21 post-infection visualized with DAPI for DNA content (blue), a polyclonal antibody specific for P. cynomolgi HSP70 protein (green) and a monoclonal antibody specific for P. cynomolgi LISP2 protein.
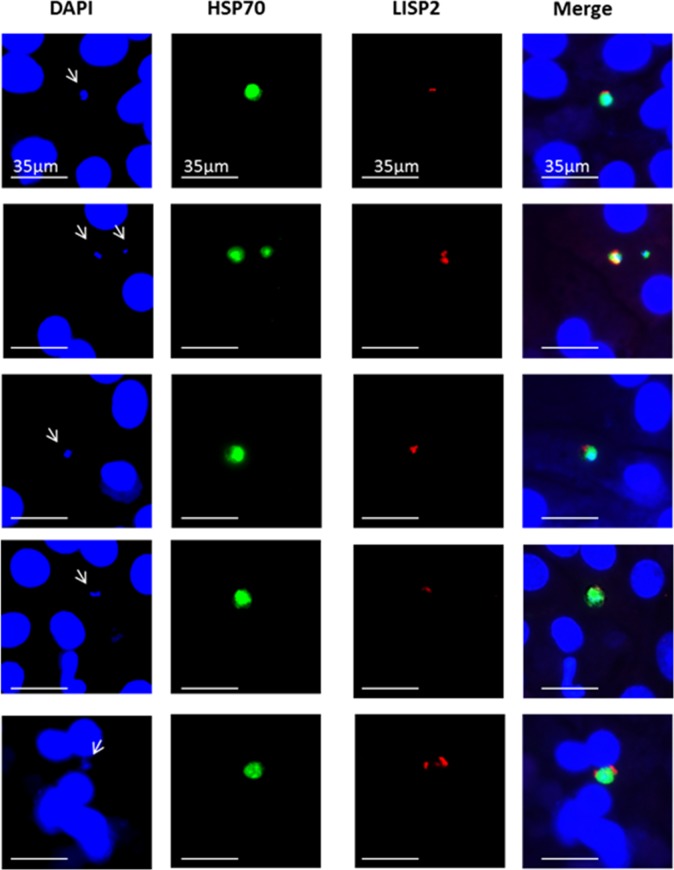
Figure 1—figure supplement 3. LISP2+ parasites on Day 3 post-infection.

Figure 1—figure supplement 3.

IFA representative images of P. cynomolgi LISP2+ parasites (trophozoite) stained with LISP2 monoclonal antibody (red color) and HSP70 antibody (green color).
Figure 1—figure supplement 4. LISP2 fluorescent in situ hybridization (FISH) staining of P. cynomolgi liver stages parasites.

Figure 1—figure supplement 4.

P. cynomolgi day 6 liver stage schizont (LISP2++), early developing trophozoite (LISP2+) and hypnozoite (LISP2-) stained by LISP2 FISH probe (green) and anti-LISP2 monoclonal antibody (red). Scale bar, 10 µm.
Figure 1—figure supplement 5. Validation of specific LISP2 RNA-FISH signal.

Figure 1—figure supplement 5.

Images shown are RNA-FISH images of day 6 P. cynomolgi EEF after 30 min RNAse A treatment (@ 5 mg/ml; 30 min at 40°C). RNAse A treatment before hybridization resulted in total disappearance of signal (left image) and revealed the specificity of LISP2 probes (green). (See Materials and methods).