. 2019 May 16;8:e43362. doi: 10.7554/eLife.43362

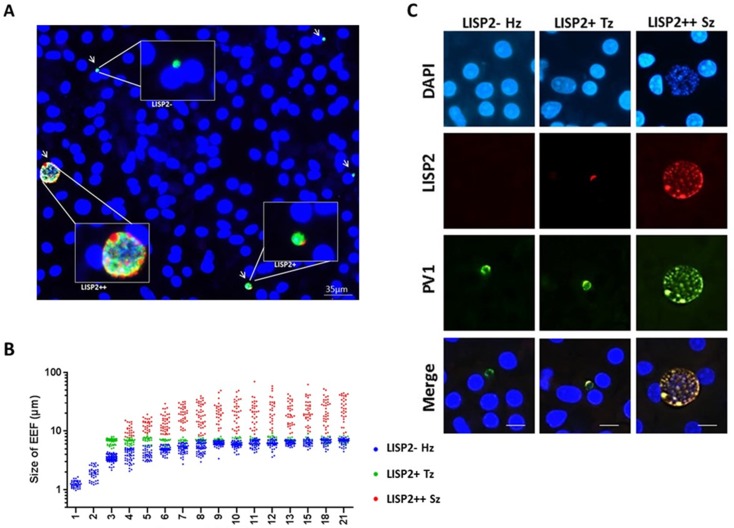
Figure 3. LISP2 expression distinguishes hypnozoites population from early developing liver stages.

(A) Immunofluorescence assay (IFA) of P. cynomolgi liver stage parasites in simian primary hepatocytes 6 days after sporozoite inoculation visualized with DAPI for DNA content (blue), a polyclonal antibody specific for P. cynomolgi HSP70 protein (green), a monoclonal antibody specific for P. cynomolgi LISP2 protein (red). Scale bar, 35 µm. Merged IFA image showing P. cynomolgi three distinct hepatic parasite populations at day 6 post-infection: LISP2- (green), LISP2+ (weak red crescent staining) and LISP2++ (strong red peripheral and vacuolar staining). (B) Growth kinetic of three distinct P. cynomolgi parasite populations, dormant hypnozoites (LISP2-), early developing trophozoite (LISP2+) and growing schizonts (LISP2++). Data for size (the diameter of the parasite) are from three independent experiments. The cumulative number of cells measured in three biological experiments for each time point from day 1 to day 21 was ≥90. (C) P. cynomolgi hepatic stages stained with LISP2 and PV1 (parasitophorous vacuole 1), a marker of PV at day 6 post-sporozoite infection. LISP2+ trophozoite and LISP2++ schizonts showed co-localization of LISP2 and PV1. In contrast, hypnozoites were devoid of any signal from anti-Pc LISP2 and were stained only by anti-Pc PV1. Scale bar, 25 µm. The source data is available for Figure 3B (see source data file Figure 3).

Figure 3—source data 1. Growth kinetics data of different liver populations for 21 days post-infection.
DOI: 10.7554/eLife.43362.015

Figure 3.

Figure 3—figure supplement 1. Relative quantitative analysis of LISP2 expressing parasites.

Figure 3—figure supplement 1.

(A) From day 1 to day 12 post-infection, the relative proportion of all three LISP2 parasites populations in monolayer infection are shown in panel A. (B) Panel B show the relative proportion of all three LISP2 parasites populations and merosomes in matrigel overlay system from day 13 to day 21 post-infection. Blue bars represent dormant hypnozoites (LISP2-), green bars are activated hypnozoites (LISP2+), red bars correspond to schizonts (LISP2++) and black bars represent merosomes. (C) Panel C show the total count of parasites at each time points from day 1 to day 21 post-sporozoite infection. The data shown in the graph (A–C) represents mean with s.d from three independent batches of hepatocytes and sporozoites (N = 3). For each independent experiment, total number of parasites at each time point was deduced from three technical replicate wells (n = 3).
Figure 3—figure supplement 1—source data 1. Relative proportion of LISP2 expressing parasites and total number of parasites assayed for 21 days post-infection.
DOI: 10.7554/eLife.43362.012
Figure 3—figure supplement 2. Assessment of viability of P. cynomolgi liver stages.

Figure 3—figure supplement 2.

Day 6 P. cynomolgi infected hepatocytes probed with anti-H3K9ac antibody, a well-known transcriptionally active marker in malaria parasite. IFA images of co-localization of H3K9ac and LISP2 in transcriptionally active hypnozoites, trophozoites and schizont are shown here. Scale bar, 20 µm.
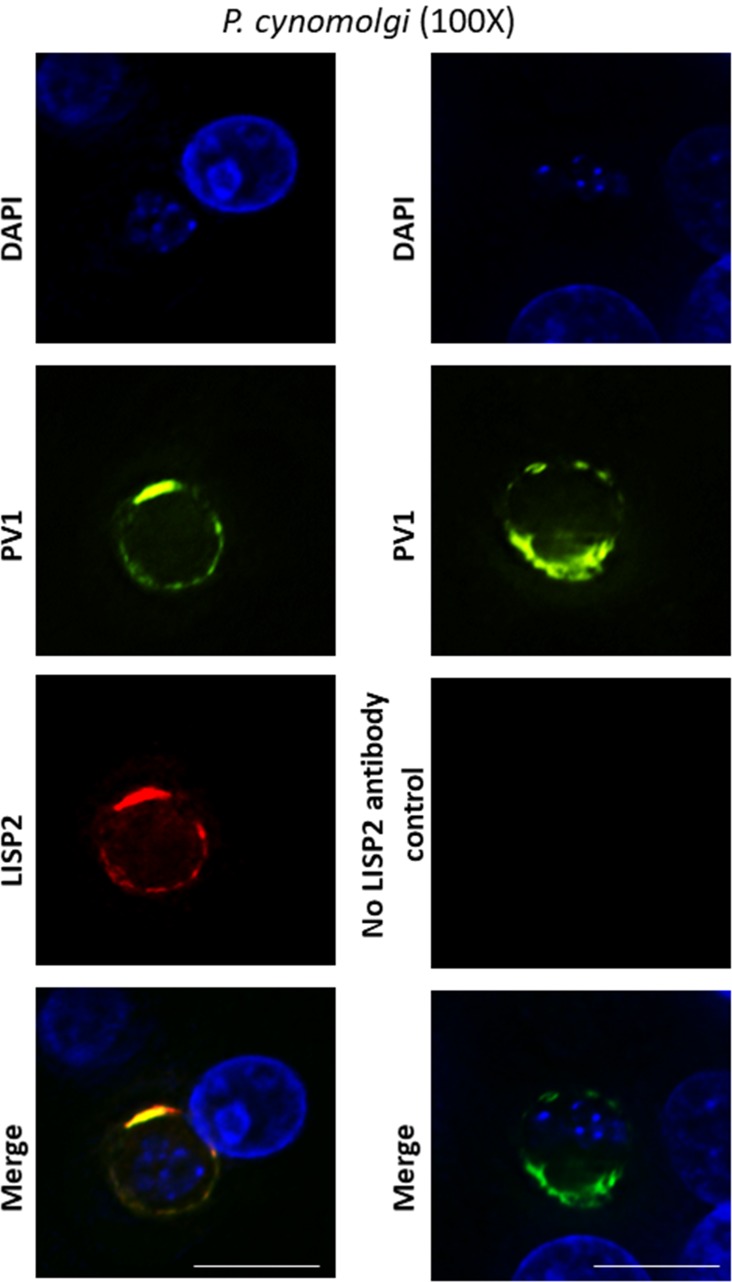
Figure 3—figure supplement 3. Co-localization of PV1 and LISP2 at parasitophorous vacuole.

Figure 3—figure supplement 3.

Deconvoluted high-resolution IFA images of day 5 hepatic stages co-stained with PV1 and LISP2 with 100X magnification (oil) are shown. Here scale bar represents 25 µm.