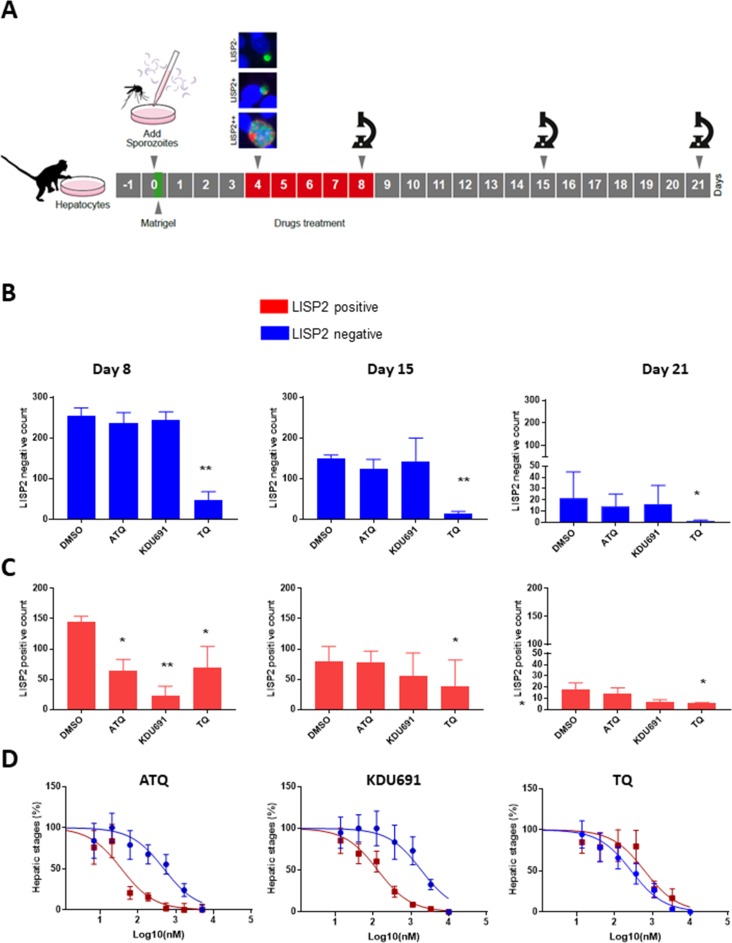
Figure 4. LISP2 negative parasites are refractory to PI4K inhibition but sensitive to 8-aminoquinoline drugs.
(A) Simian primary hepatocytes infected with P. cynomolgi parasites were exposed to ATQ (0.25 µM), KDU691 (0.5 µM) and TQ (1 µM) from day 4 to day 8 post-infection. The effects of drug treatments were compared to untreated control (DMSO) at day 8, day 15 and day 21 post-infection; p value is assessed by statistical one–tailed t test with *p<0.05 and**0.01, respectively. (B) Blue bars show drug effects on persistent LISP2- hypnozoites. (C) Red bars represent drug effects on LISP2-positive parasites. (D) Dose response curve for ATQ, KDU691 and TQ are shown. The blue curves represent drug activity against hypnozoite (LISP2-) and red curves show activity against LISP2 positive parasites. The IC50 (inhibitory concentration) of KDU691 against LISP2- hypnozoites and LISP2 expressing parasites were 1.8 µM and 0.13 µM. The IC50 of ATQ for LISP2- and LISP2 expressing parasites were 0.48 µM and 0.036 µM, respectively. The graph bar in Figure 4B and C represent mean with standard deviation (s.d) from five technical replicates in two independent biological assays, whereas in Figure 4D from three independent biological assays. The source data is available for Figure 4 (see source data file Figure 4).


