. 2019 May 21;8:e44182. doi: 10.7554/eLife.44182

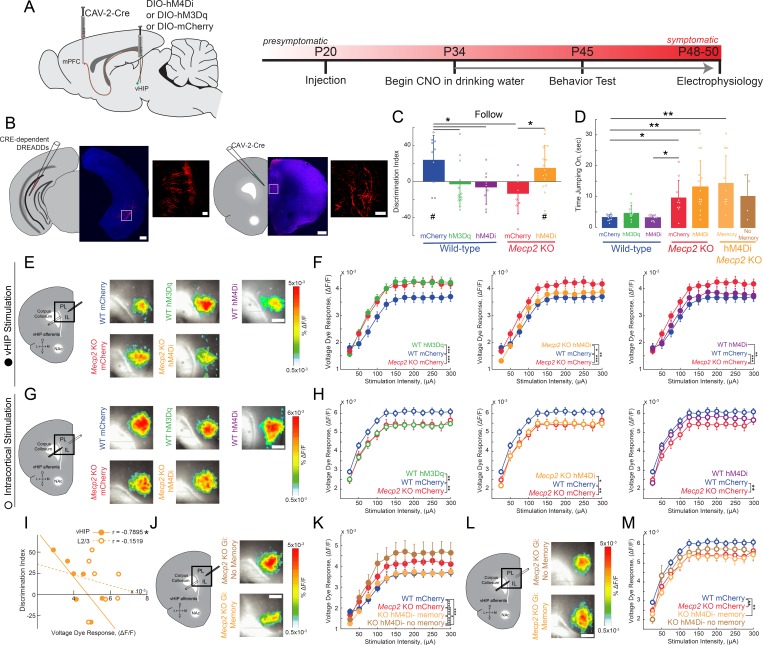
Figure 4. Activity of mPFC-projecting vHIP neurons modulates social memory in WT and Mecp2 KO mice.

(A) Schematic of CAV2-Cre and DREADD injections and experimental timeline. (B) Injection sites show sparse mCherry labeling of vHIP neurons with identifiable axons in the mPFC. Scale bar 500 µm large, 100 µm inset. (C) Discrimination Index of following familiar versus novel mice in unrestricted social interaction, scored by JAABA (n = 10 mCherry WT mice, p=0.0202; n = 12 hM3Dq WT mice, p=0.6905; n = 9 hM4Di WT mice, p=0.3332; n = 10 mCherry Mecp2 KO, p=0.1322; n = 15 Mecp2 KO mice, p=0.0312; One-sample Student’s t-test against chance. mCherry WT vs. hM3Dq WT mice, p=0.0287; mCherry WT vs. hM4Di WT mice, p=0.0081; mCherry WT vs. mCherry Mecp2 KO mice, p=0.0187; mCherry Mecp2 KO vs. hM3Dq WT mice p=0.4674; mCherry Mecp2 KO vs. hM4Di WT mice, p=0.6108; mCherry Mecp2 KO mice vs. hM4Di Mecp2 KO mice, p=0.0287; ANOVA p=0.0048; One-Way ANOVA with Benjamini and Hochberg Multiple Comparisons). (D) Time spent ‘jumping on’ other mice during unrestricted social interaction (n = 9 mCherry WT mice; n = 12 hM3Dq WT mice; n = 9 hM4Di WT mice; n = 10 mCherry Mecp2 KO; n = 15 hM4Di Mecp2 KO mice; mCherry WT vs. mCherry Mecp2 KO, p=0.0215; hM3Dq WT vs. mCherry WT, p>0.9999; hM3Dq WT vs. hM4Di WT, p>0.9999; hM3Dq WT vs. mCherry Mecp2 KO, p=0.2119; hM4Di WT vs. mCherry WT, p>0.9999; hM4Di WT vs. mCherry Mecp2 KO, p=0.0194; mCherry Mecp2 KO vs. hM4Di (All) Mecp2 KO, p>0.9999; hM4Di (All) Mecp2 KO vs. mCherry WT, p=0.0016; Memory hM4Di vs. mCherry KO, p>0.9999; Memory hM4Di vs. mCherry WT, p=0.0012; No Memory hM4Di vs. mCherry Mecp2 KO, p>0.9999; No Memory hM4Di vs. mCherry WT, p=0.8023; Memory hM4Di vs. No Memory hM4Di, p>0.9999, Kruskal-Wallis test with Dunn’s multiple corrections). (E) Representative VSD responses evoked by vHIP fiber stimulation in CNO-treated mice. Scale bar 200 µm. (F) Input-output relationships of peak VSD responses evoked by vHIP fiber stimulation. (mCherry WT vs. mCherry Mecp2 KO, p<0.001; hM3Dq WT vs. mCherry WT, p<0.0001; hM3Dq WT vs. mCherry Mecp2 KO, p=0.6530; mCherry WT vs. hM4Di, p=0.0642; hM4Di WT vs. mCherry Mecp2 KO, p=0.0013; hM4Di Mecp2 KO vs. mCherry WT, p=0.0333; hM4Di Mecp2 KO vs. mCherry Mecp2 KO, p=0.0016; Interaction p<0.0001; Stim p<0.0001; Group p=0.0193; Two-way RM ANOVA with Benjamini and Hochberg Multiple Comparisons). (G) Representative VSD responses evoked by intracortical stimulation in CNO-treated mice. (H) Input-output relationships of peak VSD responses evoked by intracortical stimulation (mCherry WT vs. mCherry Mecp2 KO, p<0.0001; hM3Dq WT vs. mCherry WT, p<0.0001; hM3Dq WT vs. mCherry Mecp2 KO, p 0.2164; mCherry WT vs. hM4Di WT, p=0.8296; hM4Di WT vs. mCherry Mecp2 KO, p<0.0001; hM4Di Mecp2 KO vs. mCherry WT, p=0.0023; hM4Di Mecp2 KO vs. mCherry Mecp2 KO, p=0.0726; Interaction p=0.2985; Stim p<0.0001; Group p=0.0479; Two-way RM ANOVA with Benjamini and Hochberg Multiple Comparisons). (I) Correlation between social memory DIs and VSD responses evoked by either vHIP fiber (closed circles) or intracortical stimulation (open circles) (n = 7 slices from 7 hM4Di Mecp2 KO mice; Spearman r correlation; r = −0.7895, p=0.0347 vHIP fiber; r = −0.1519, p=0.7451 intracortical). (J–K) Input-output relationships of peak VSD responses evoked by vHIP fiber stimulation in slices from hM4Di Mecp2 KO mice with intact or impaired social memory (Memory vs. mCherry WT, p=0.3043; Memory vs. mCherry Mecp2 KO, p<0.0001; No Memory vs. mCherry WT, p<0.0001; No Memory vs. mCherry Mecp2 KO, p=0.0406; Memory vs. No Memory, p<0.0001; Interaction p<0.0001; Stim p<0.0001; Group p=0.0056; Two-way RM ANOVA with Benjamini and Hochberg Multiple Comparisons). (L–M) Input-output relationships of peak VSD responses evoked by intracortical stimulation in slices from hM4Di Mecp2 KO mice with intact or impaired social memory (Memory vs. mCherry WT, p=0.0002; Memory vs. mCherry Mecp2 KO, p=0.3043; No Memory vs. mCherry WT, p=0.2171, No Memory vs. mCherry Mecp2 KO, p=0.0720; Memory vs. No Memory, p=0.2171; Interaction p=0.2241; Stim p<0.0001; Group p=0.0761; Two-way RM ANOVA with Benjamini and Hochberg Multiple Comparisons). (E–M) n = 18 slices from 9 mCherry (18/9) WT mice; n = 12/8 hM3Dq WT mice; n = 16/9 hM4Di WT mice; n = 17/8 mCherry Mecp2 KO mice; n = 20/10 hM4Di Mecp2 KO mice; n = 11/6 hM4Di Mecp2 KO memory mice; n = 6/4 hM4Di Mecp2 KO no memory mice). (C–D) Mean ± SD; (F,H,K,M) Mean ± SEM; *p<0.05, **p<0.01. Figure 4—source data 1. See also Figure 4—figure supplements 15.

Figure 4—source data 1. VSD responses to vHIP stimulation in mPFC slices and LTP at vHIP-mPFC synapses are not altered in presymptomatic Mecp2KO mice.
DOI: 10.7554/eLife.44182.027

Figure 4.

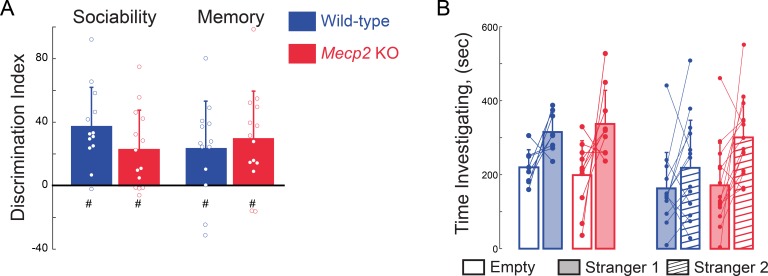
Figure 4—figure supplement 1. Social memory is not altered in presymptomatic Mecp2 KO mice.

Figure 4—figure supplement 1.

(A) Discrimination index of time spent investigating the empty inverted pencil cup or the cup containing either stranger 1 or stranger 2 (WT sociability, p=0.0001; Mecp2 KO sociability, p=0.0046; WT memory, p=0.0149; Mecp2 KO memory, p=0.0027; One-sample t-test against chance; WT vs.Mecp2 KO sociability, p=0.1394; WT vs. Mecp2 KO memory, p=0.6001; two-sample t-test; n = 8 WT mice; n = 10 Mecp2 KO). * denotes significant differences between groups, # denotes significant difference from chance values. (B) Absolute times for three chamber social task. Mean ± SD; *, # p<0.05, **p<0.01.
Figure 4—figure supplement 1—source data 1. VSD responses to vHIP stimulation in mPFC slices and LTP at vHIP-mPFC synapses are not altered in presymptomatic Mecp2KO mice.
DOI: 10.7554/eLife.44182.018
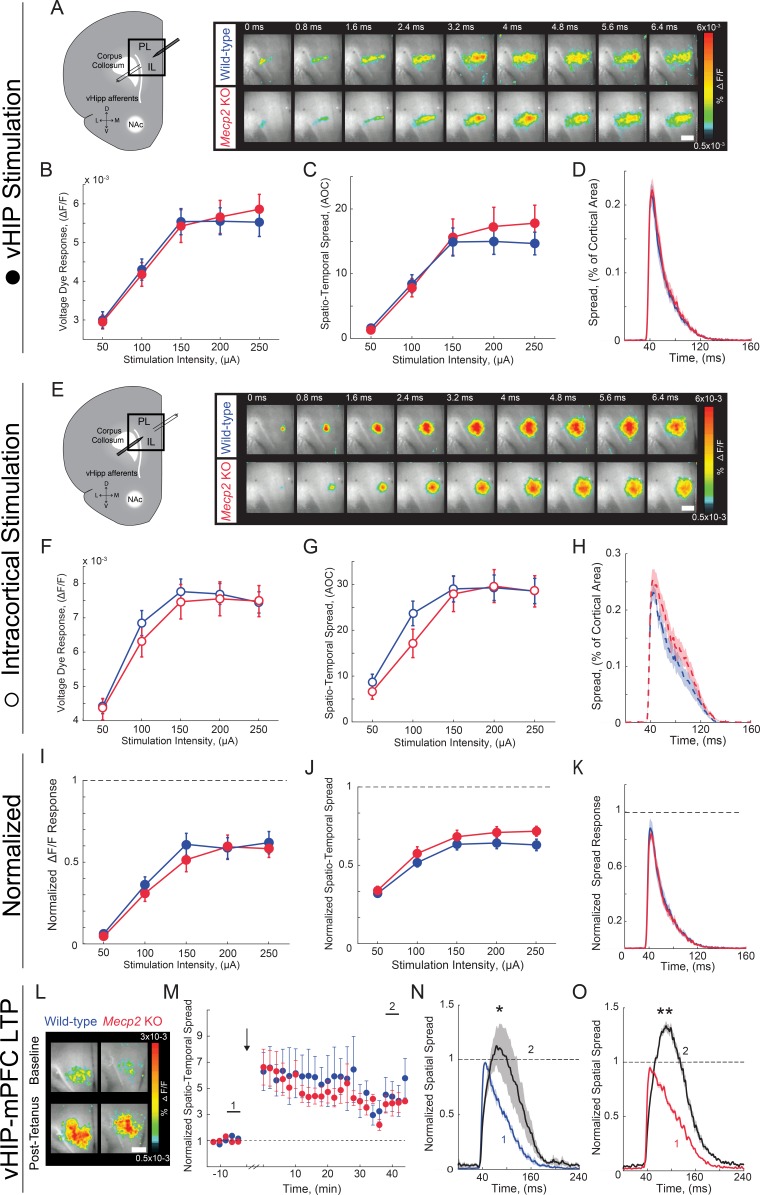
Figure 4—figure supplement 2. VSD responses to vHIP stimulation in mPFC slices and LTP at vHIP-mPFC synapses are not altered in presymptomatic Mecp2 KO mice.

Figure 4—figure supplement 2.

(A) Schematic of VSD imaging in an mPFC slice during stimulation of vHIP fibers and representative VSD responses evoked by a single vHIP fiber stimulation. Scale bar 100 µm. (B–D) Input-output relationships of VSD peak responses (B) p=0.424, Two-way ANOVA), spatiotemporal spread (C) p=0.625, Two-way RM ANOVA), and spread over time (D) p=0.2918 Student’s t-test) (at 150 µA intensity) evoked by a single vHIP fiber stimulation. (E) Schematic of VSD imaging in an mPFC slice during stimulation of intracortical fibers and representative VSD responses evoked by a single intracortical stimulation. (F–H) Input-output relationships of VSD peak responses (F) p=0.4663, Two-way ANOVA), spatiotemporal spread (G) p=0.3972, Two-Way RM ANOVA), and spread over time (H) p=0.2582, Student’s t-test) (at 150 µA intensity) evoked by a single intracortical stimulation. (I–K) Peak VSD responses (I) p=0.2278, Two-way RM ANOVA), spatiotemporal spread (J) p=0.5857, Two-way ANOVA), and spread over time (K) p=0.9145, Student’s t-test) evoked by a single vHIP fiber stimulation normalized to those evoked by a single intracortical stimulation. (A–K) n = 14 slices from five mice WT; n = 18 5 Mecp2 KO mice). (L) Representative images of peak VSD responses to a single test stimulation before and after high-frequency stimulation to induce LTP. (M) Normalized spatiotemporal spread of single test VSD responses before and after LTP induction; high-frequency stimulation given at arrow. (N–O) Spread over time of single test VSD responses at baseline (1) and 40 min after LTP induction (2), normalized to baseline peak spread in WT slices (N) p=0.0159, Wilcoxon paired test) and Mecp2 KO slices (o) p=2.165×10⁻⁵, Wilcoxon paired test) (L–N) n = 5 slices from 5 WT mice; n = 9/5 Mecp2 KO mice). Spatiotemporal spread is the AOC created by spread of the cortical area (% of total) and time (ms). Mean ± SEM; *p<0.05, **p<0.01.
Figure 4—figure supplement 2—source data 1. VSD responses to vHIP stimulation in mPFC slices of Mecp2KO mice do not develop in a typical manner.
DOI: 10.7554/eLife.44182.020
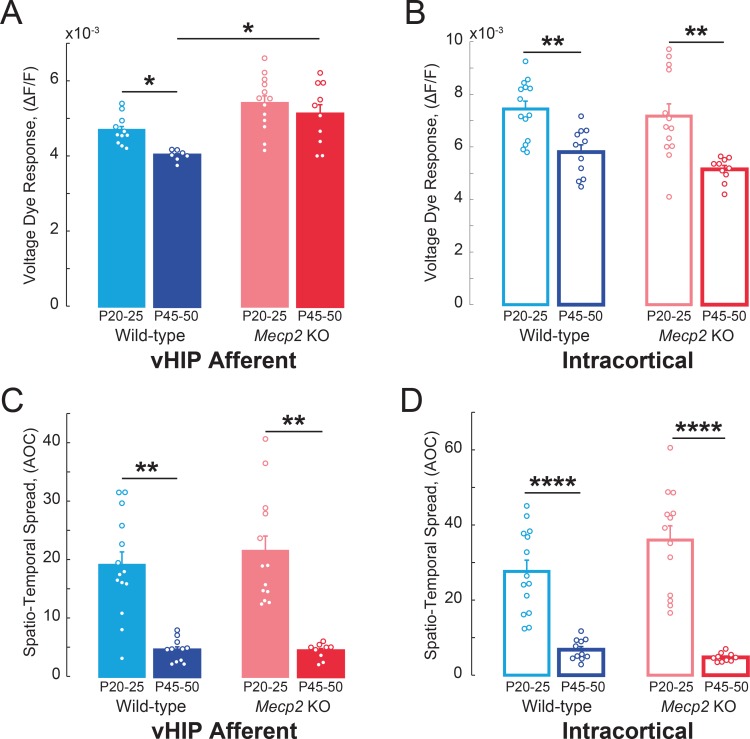
Figure 4—figure supplement 3. VSD responses to vHIP stimulation in mPFC slices of Mecp2 KO mice do not develop in a typical manner.

Figure 4—figure supplement 3.

(A–B) Peak VSD responses evoked by either (A) a single vHIP fiber stimulation or (B) a single intracortical stimulation in mPFC slices from WT and Mecp2 KO mice at P20-25 and P45-50 (WT young vs.WT adult vHIP p=0.0151; WT young vs. Mecp2 KO young vHIP p=0.4678; Mecp2 KO young vs. Mecp2 KO adult vHIP p=0.4678; WT adult vs. Mecp2 KO adult vHIP p=0.0157; Interaction p=0.1166; Age p=0.0061; Genotype p=0.0099; Two-Way ANOVA with Benjamini and Hochberg Multiple Comparisons; WT young vs. WT adult intracortical p=0.0020; WT young vs. Mecp2 KO young intracortical p=0.4145; Mecp2 KO young vs. Mecp2 KO adult intracortical p=0.0018; WT adult vs. Mecp2 KO adult intracortical p=0.3699; Interaction p=0.8253; Age p<0.0001; Genotype p=0.1946; Two-Way ANOVA with Benjamini and Hochberg Multiple Comparisons). (C–D) Spatiotemporal spread of VSD signals evoked by (C) vHIP afferent stimulation or (D) intracortical stimulation in mPFC slices from WT and Mecp2 KO mice at P20-25 and P45-50 (WT young vs. WT adult vHIP p<0.0001; WT young vs. Mecp2 KO young vHIP, p=0.9532; Mecp2 KO young vs. Mecp2 KO adult vHIP, p<0.001; WT adult vs. Mecp2 KO adult vHIP, p=0.9532; Interaction p=0.9336; Age p<0.0001; Genotype p=0.8700; Two-Way ANOVA with Benjamini and Hochberg Multiple Comparisons; WT young vs. WT adult intracortical, p<0.0001; WT young vs. Mecp2 KO young intracortical, p=0.2549; Mecp2 KO young vs. Mecp2 KO adult intracortical p<0.0001; WT adult vs. Mecp2 KO adult intracortical, p=0.6539; Interaction p=0.2358; Age p<0.0001; Genotype p=0.5842; Two-Way ANOVA with Benjamini and Hochberg Multiple Comparisons) (n = 14 slices from 5 P20-25 WT mice; n = 18/5 P20-25 Mecp2 KO, n = 11/7 P45-55 WT mice, n = 11/5 P45-55 Mecp2 KO mice; Spatiotemporal spread = AOC created by spread of the cortical area (% of total) and time (ms). Mean ± SEM; *p<0.05, **p<0.01.
Figure 4—figure supplement 3—source data 1. Lack of effects of long-term DREADD stimulation by CNO on anxiety and general (non-social memory) behaviors.
DOI: 10.7554/eLife.44182.022
Figure 4—figure supplement 4. Lack of effects of long-term DREADD stimulation by CNO on anxiety and general (non-social memory) behaviors.

Figure 4—figure supplement 4.

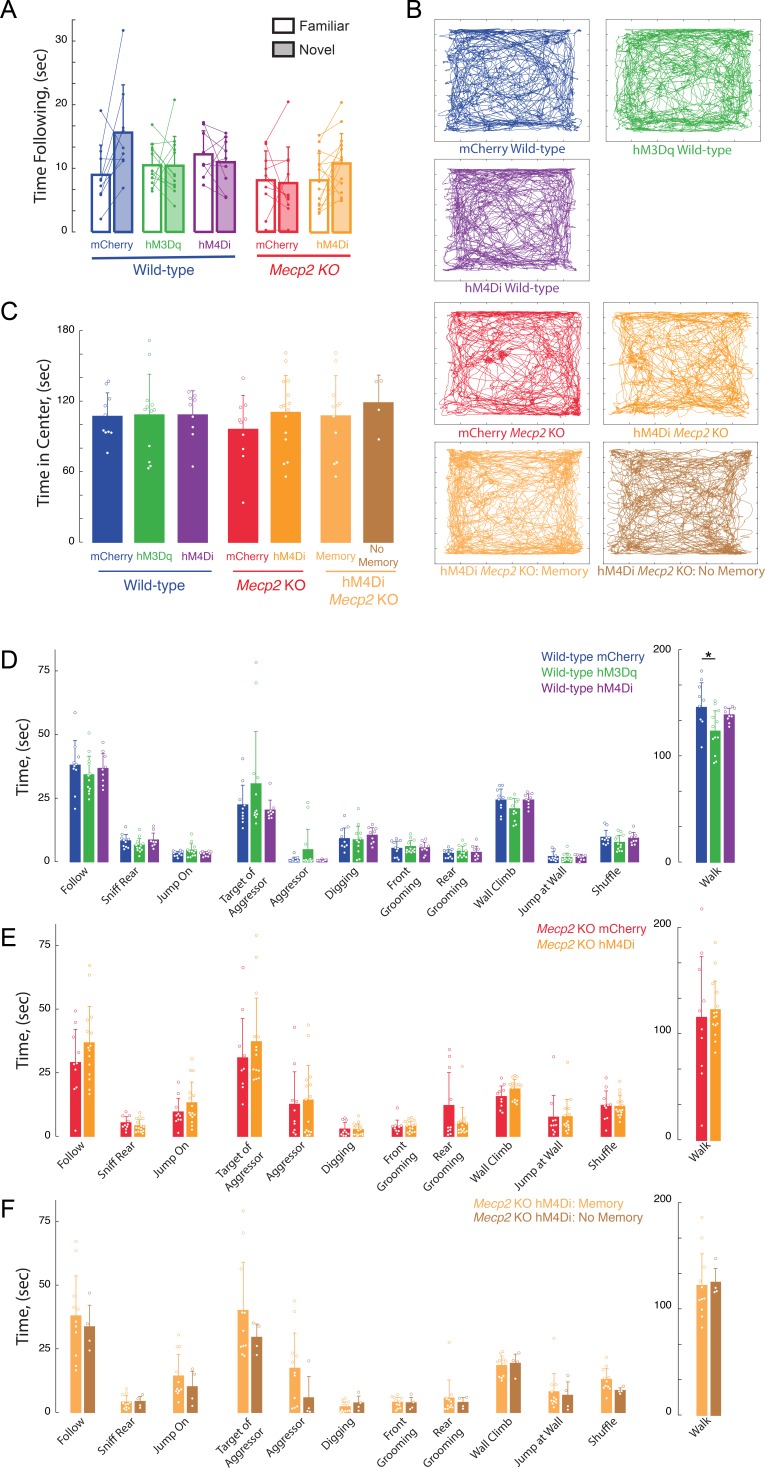
(A) Total times spent following novel vs. familiar sentinels. (B) Representative tracks of individual trajectories of test mice during social encounters in an open field. (C) Average time spent in the center of the open field, as a measure of anxiety (mCherry vs. hM3Dq WT p>0.9999; mCherry WT vs. Mecp2 KO, p=0.9793; hM3Dq WT vs. mCherry Mecp2 KO, p=0.9566; mCherry vs. hM4Di WT, p>0.9999; hM4Di WT vs. mCherry Mecp2 KO, p=0.9695; hM3Dq WT vs. hM4Di WT p>0.9999; mCherry vs. hM4Di (All) Mecp2 KO, p=0.8910; hM4Di (All) Mecp2 KO vs. mCherry WT, p>0.9999; mCherry NAc vs. mCherry mPFC WT, p=0.9492; mCherry vs. hM3Dq NAc WT, p=0.9952; Memory vs. mCherry Mecp2 KO, p=0.9727; Memory vs. mCherry WT, p>0.9999; No Memory vs. mCherry Mecp2 KO, p=0.8493; No Memory vs. mCherry WT, p=0.9941; Memory vs. No Memory, p=0.9947; One-way ANOVA with Turkey’s multiple comparisons). (D–F) Time spent engaging in social, aggressive, general, and locomotor behaviors during the unrestricted social interaction assay in (D) DREADD-expressing WT mice, (E) Mecp2 KO mice, and hM4Di Mecp2 KO mice separated by memory performance (F) after long-term CNO treatment (n = 9 mCherry WT mice; n = 12 hM3Dq WT mice; n = 9 hM4Di WT mice; One-Way ANOVA or Kruskal-Wallis test dependent on normalcy; n = 10 mCherry Mecp2 KO; n = 15 hM4Di Mecp2 KO mice; Student’s t-test or Mann-Whitney test dependent on normalcy).
Figure 4—figure supplement 4—source data 1. Memory Discrimination correlates to vHIP input to the mPFC in Mecp2KO mice.
DOI: 10.7554/eLife.44182.024
Figure 4—figure supplement 5. Memory Discrimination correlates to vHIP input to the mPFC in Mecp2 KO mice.

Figure 4—figure supplement 5.

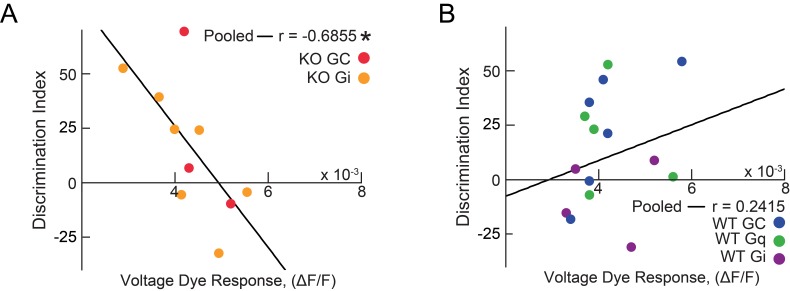
(A) Correlation between social memory DI and VSD responses evoked by vHIP fiber stimulation in Mecp2 KO mice expressing mCherry (red) or hM4Di (yellow), with correlation for pooled data (n = 10 slices from 10 Mecp2 KO mice; Spearman r correlation; r = −0.6855, p=0.0287). (B) Correlation between social memory DI and VSD responses evoked by vHIP fiber stimulation in WT KO mice expressing mCherry (blue), hM3Dq (green), or hM4Di (purple), with correlation for pooled data (n = 15 slices from 15 WT KO mice; Spearman r correlation; r = 0.2415, p=0.3859).
Figure 4—figure supplement 5—source data 1. Activity of mPFC-projecting vHIP neurons modulates social memory in WT and Mecp2KO mice.
DOI: 10.7554/eLife.44182.026